Lent, Not Spent
Since the Fed's hike, November crude has lost $6.40 while December 2027 gained $3.01: the emergency barrels pulling this winter's price down are loans, repaid with interest from November into 2028.
Prices through 2 October 2026 · COT through the 29 September report · Data: ChartHorizon, CFTC, CME Group, U.S. Department of Energy, EIA, U.S. Treasury, Federal Reserve, FRED & press reports · Charts: ChartHorizon
Two weeks ago, on the day the Federal Reserve raised its rate into $100 oil, this desk’s note Priced to Pass read the futures curve as a market that expected the shock to pass. It closed with four tests and a promise to report back.
Since that Wednesday the November WTI contract has fallen from $97.51 to $91.11. December 2027 has risen from $72.55 to $75.56. The gap between them has gone from $24.96 to $15.55 in twelve sessions. The American barrel for this winter got cheaper and the barrel for next year got dearer, at the same time.
The first half of that has a plain explanation, and it is mostly American. The second half has more than one cause, and one of them is written into the terms on which the world’s emergency oil is being handed out.
What eased, and what did not
Saudi Arabia was reported restarting its East-West pipeline on 22 September, and on Friday it was said to be carrying more than 80 per cent of its capacity, ahead of the six weeks Aramco had given for a full return. More oil also went the short way. Saudi shipments through the Strait of Hormuz averaged 2.9 million barrels a day in September, against about one million in August, and total flows through the strait were the highest since the war began.
Then the stockpiles. On 29 September the Energy Department offered up to 40 million barrels from the Strategic Petroleum Reserve, the last tranche of the 172 million ordered in March. On Friday the G7, in a statement presented by President Macron, said its members would release up to 100 million barrels of crude and diesel over four months, with a “frontloaded substantial release” of diesel within twenty days. Washington had pressed Europe to act, with a ban on American diesel exports as the alternative. November WTI settled 1.9 per cent lower that afternoon. December Brent finished almost exactly where it started.
What did not ease was the war. Iran’s president said on 23 September that the country would not surrender, and Brent rose 4 per cent that day. On Thursday, with word that a third American carrier strike group and an amphibious group carrying more than 2,000 Marines were heading for the region, it rose 4 per cent again.
The curve, two weeks on
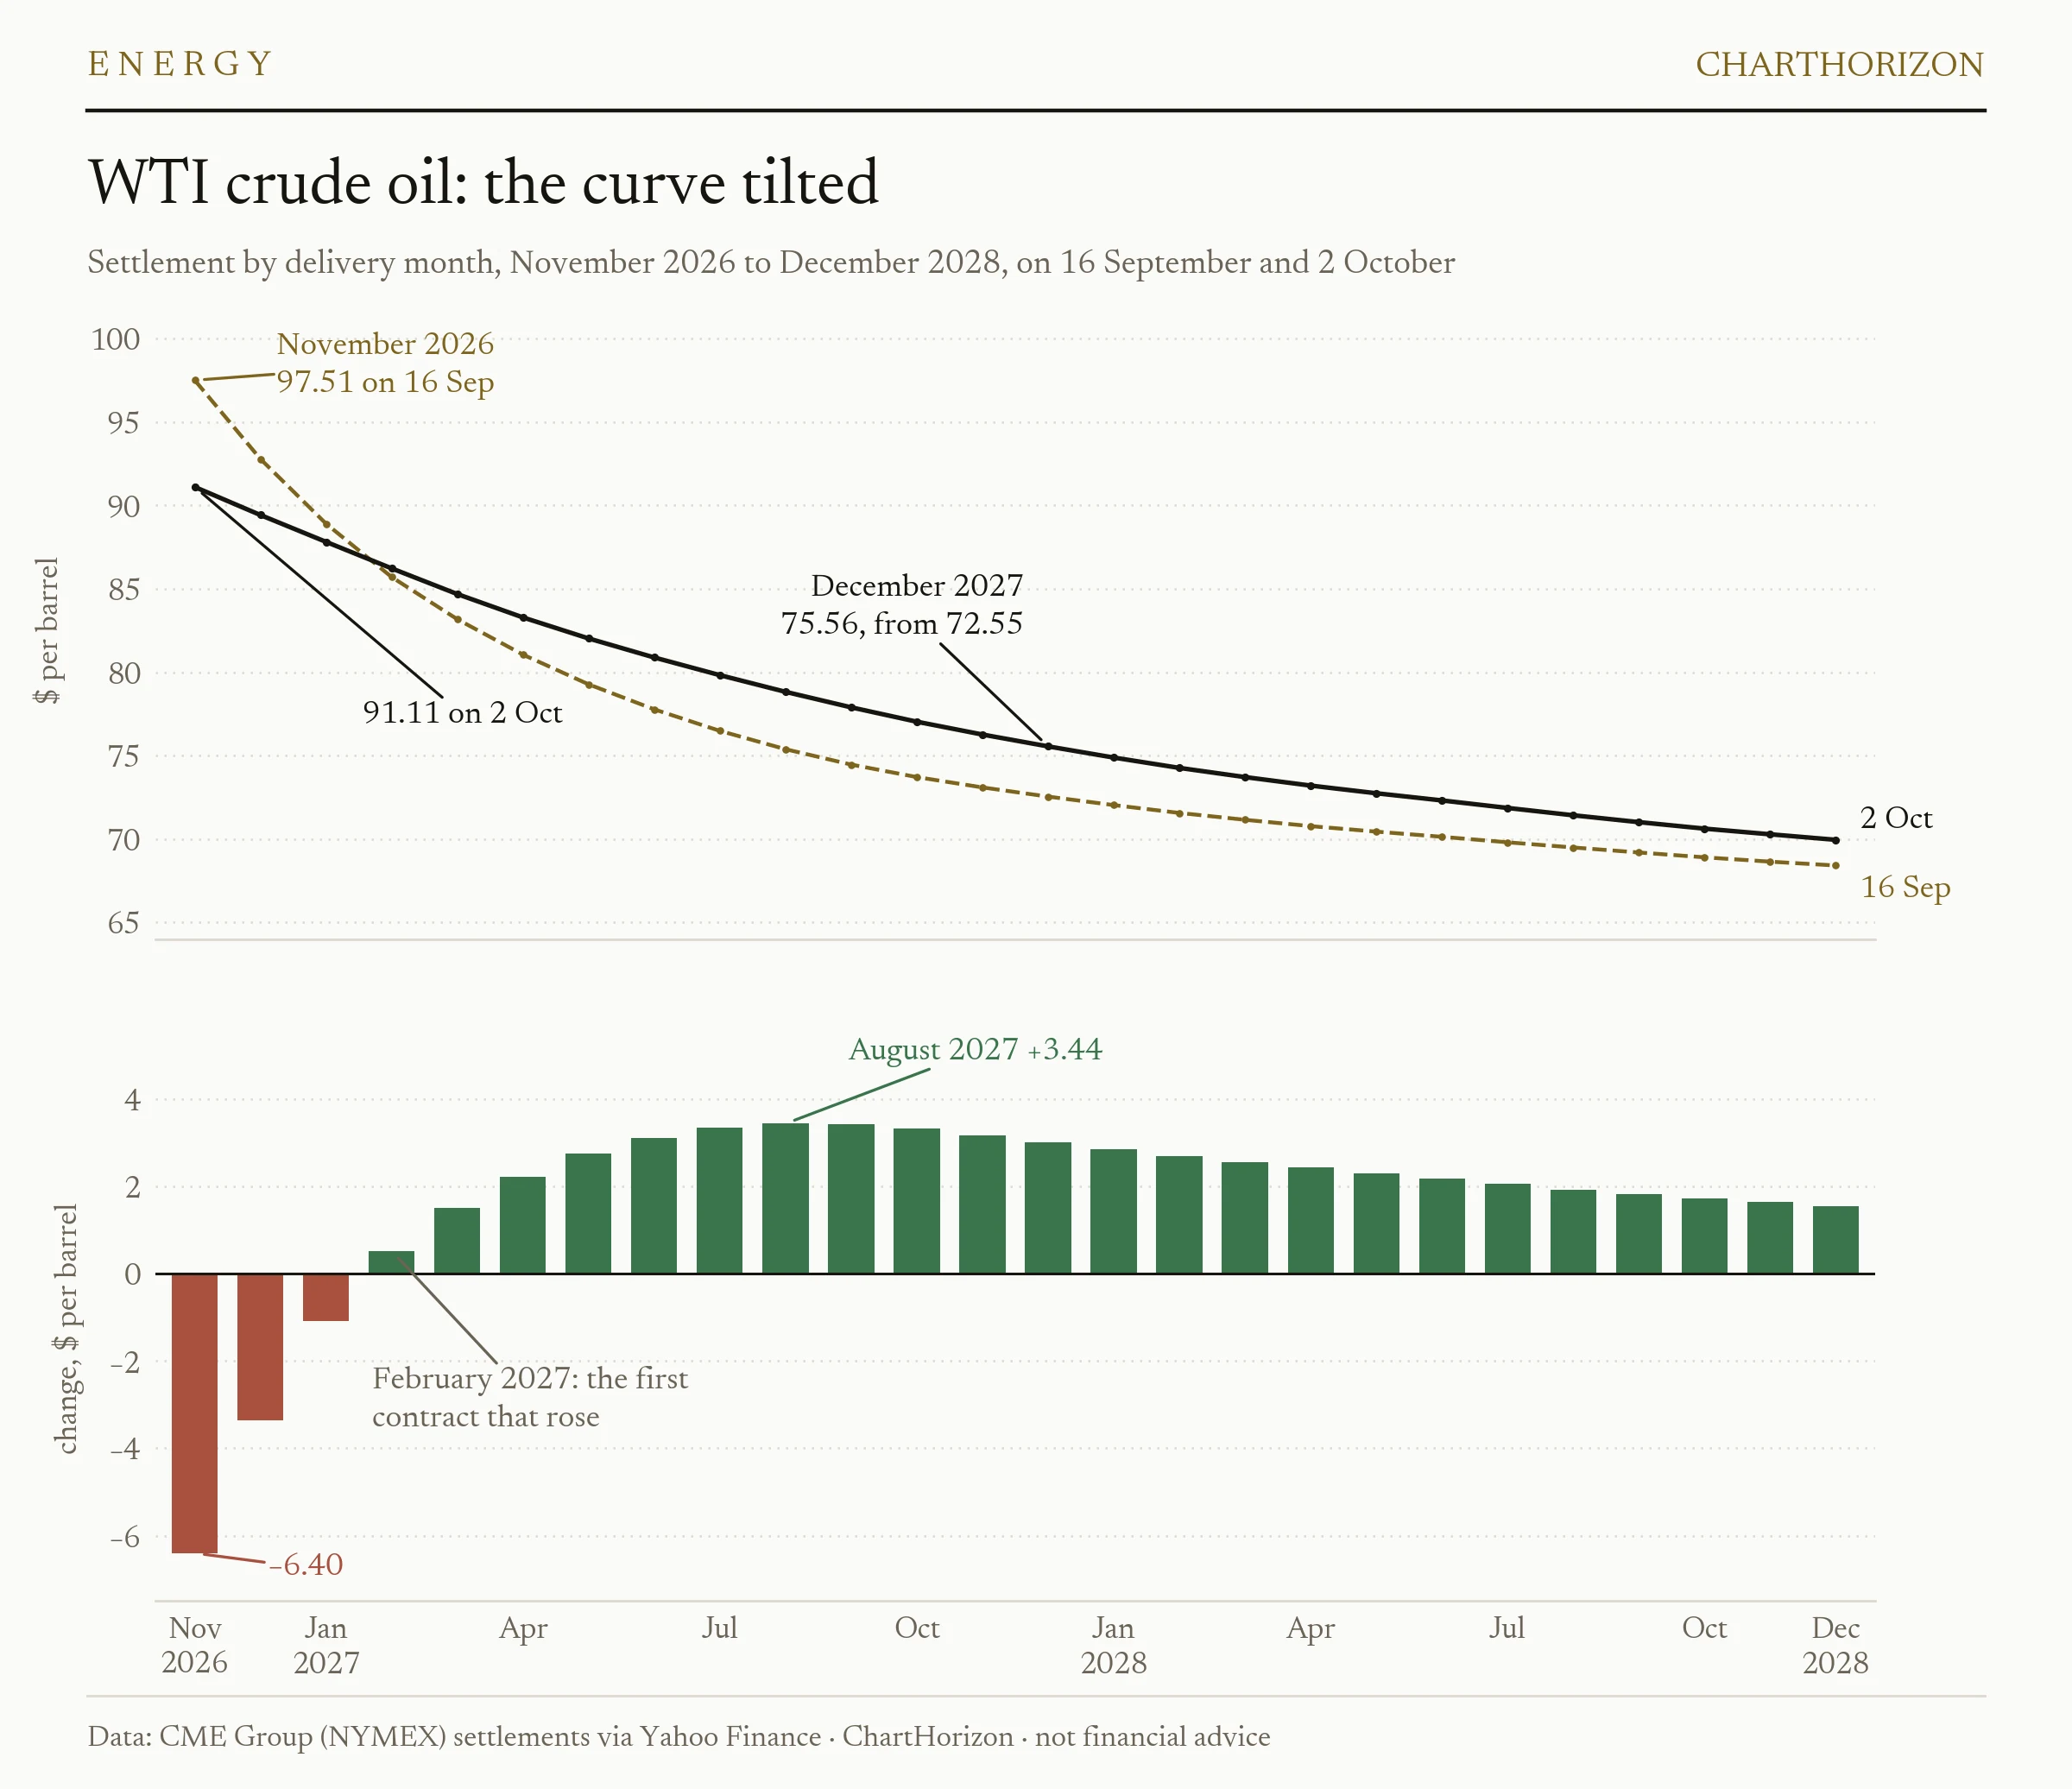
Every contract from November 2026 to January 2027 settled lower on Friday than on 16 September. Every contract from February 2027 to December 2028, the last on the chart, settled higher. The largest gain, $3.44, was in August 2027. The twelve months of 2027 averaged $80.87 on Friday, against $78.47 on the day of the hike, and 2028 rose from $70.05 to $72.20.
If the front had simply come back down after a rally, the back of the curve would have stayed where it was. It did not stay, and not only in America: December 2027 Brent rose from $78.39 to $81.93. The shock got smaller in America, and it got longer everywhere.
Part of that is the war. A third carrier group is not the sign of a conflict about to end, and a risk premium that was priced for weeks moves down the curve when weeks start to look like seasons. The other part is less visible.
A loan, not a sale
The American reserve is not being sold. The 172 million barrels ordered in March are being lent through exchanges: a refiner or trader takes crude now and returns it later, with extra barrels as interest. The Energy Department says its exchanges have won a premium of 25 per cent. Under the terms published in the spring, the barrels come back between November 2026 and September 2028. “These exchanges will also ensure America’s Strategic Petroleum Reserve continues to be refilled,” Energy Secretary Chris Wright said of the latest offer.
The reserve held 283.8 million barrels in the week to 25 September, according to the Energy Information Administration. That is the least since October 1982, and 131.7 million fewer than in March.
So the barrels that have pushed this autumn’s price down are owed back, with about a quarter added, over the next two years. Whoever borrowed them is short those future barrels until they buy them, and the way to cover that in advance is to buy deferred futures. In that sense the barrels lent this winter are already demand in 2027. The commitments report cannot show who bought December 2027 these past two weeks, because it does not split positions by delivery month. But the chart has the shape this arrangement produces: lower prices while the barrels flow out, higher prices in the months they are due back. It is not the only cause, but it is the one with a schedule. The G7’s barrels come from stocks that members are obliged to hold, and those will have to be rebuilt too.
The arrangement also limits itself. Leaving aside the cost of money, a company that takes a barrel now and hands back 1.25 barrels a year later comes out ahead only if today’s barrel is worth at least a quarter more than next year’s. On 16 September December 2026 crude cost 27.9 per cent more than December 2027. On Friday it cost 18.4 per cent more. At a 25 per cent premium, borrowing for a year on those two contracts no longer pays. Bids for the last 40 million barrels close on Tuesday.
The American barrel
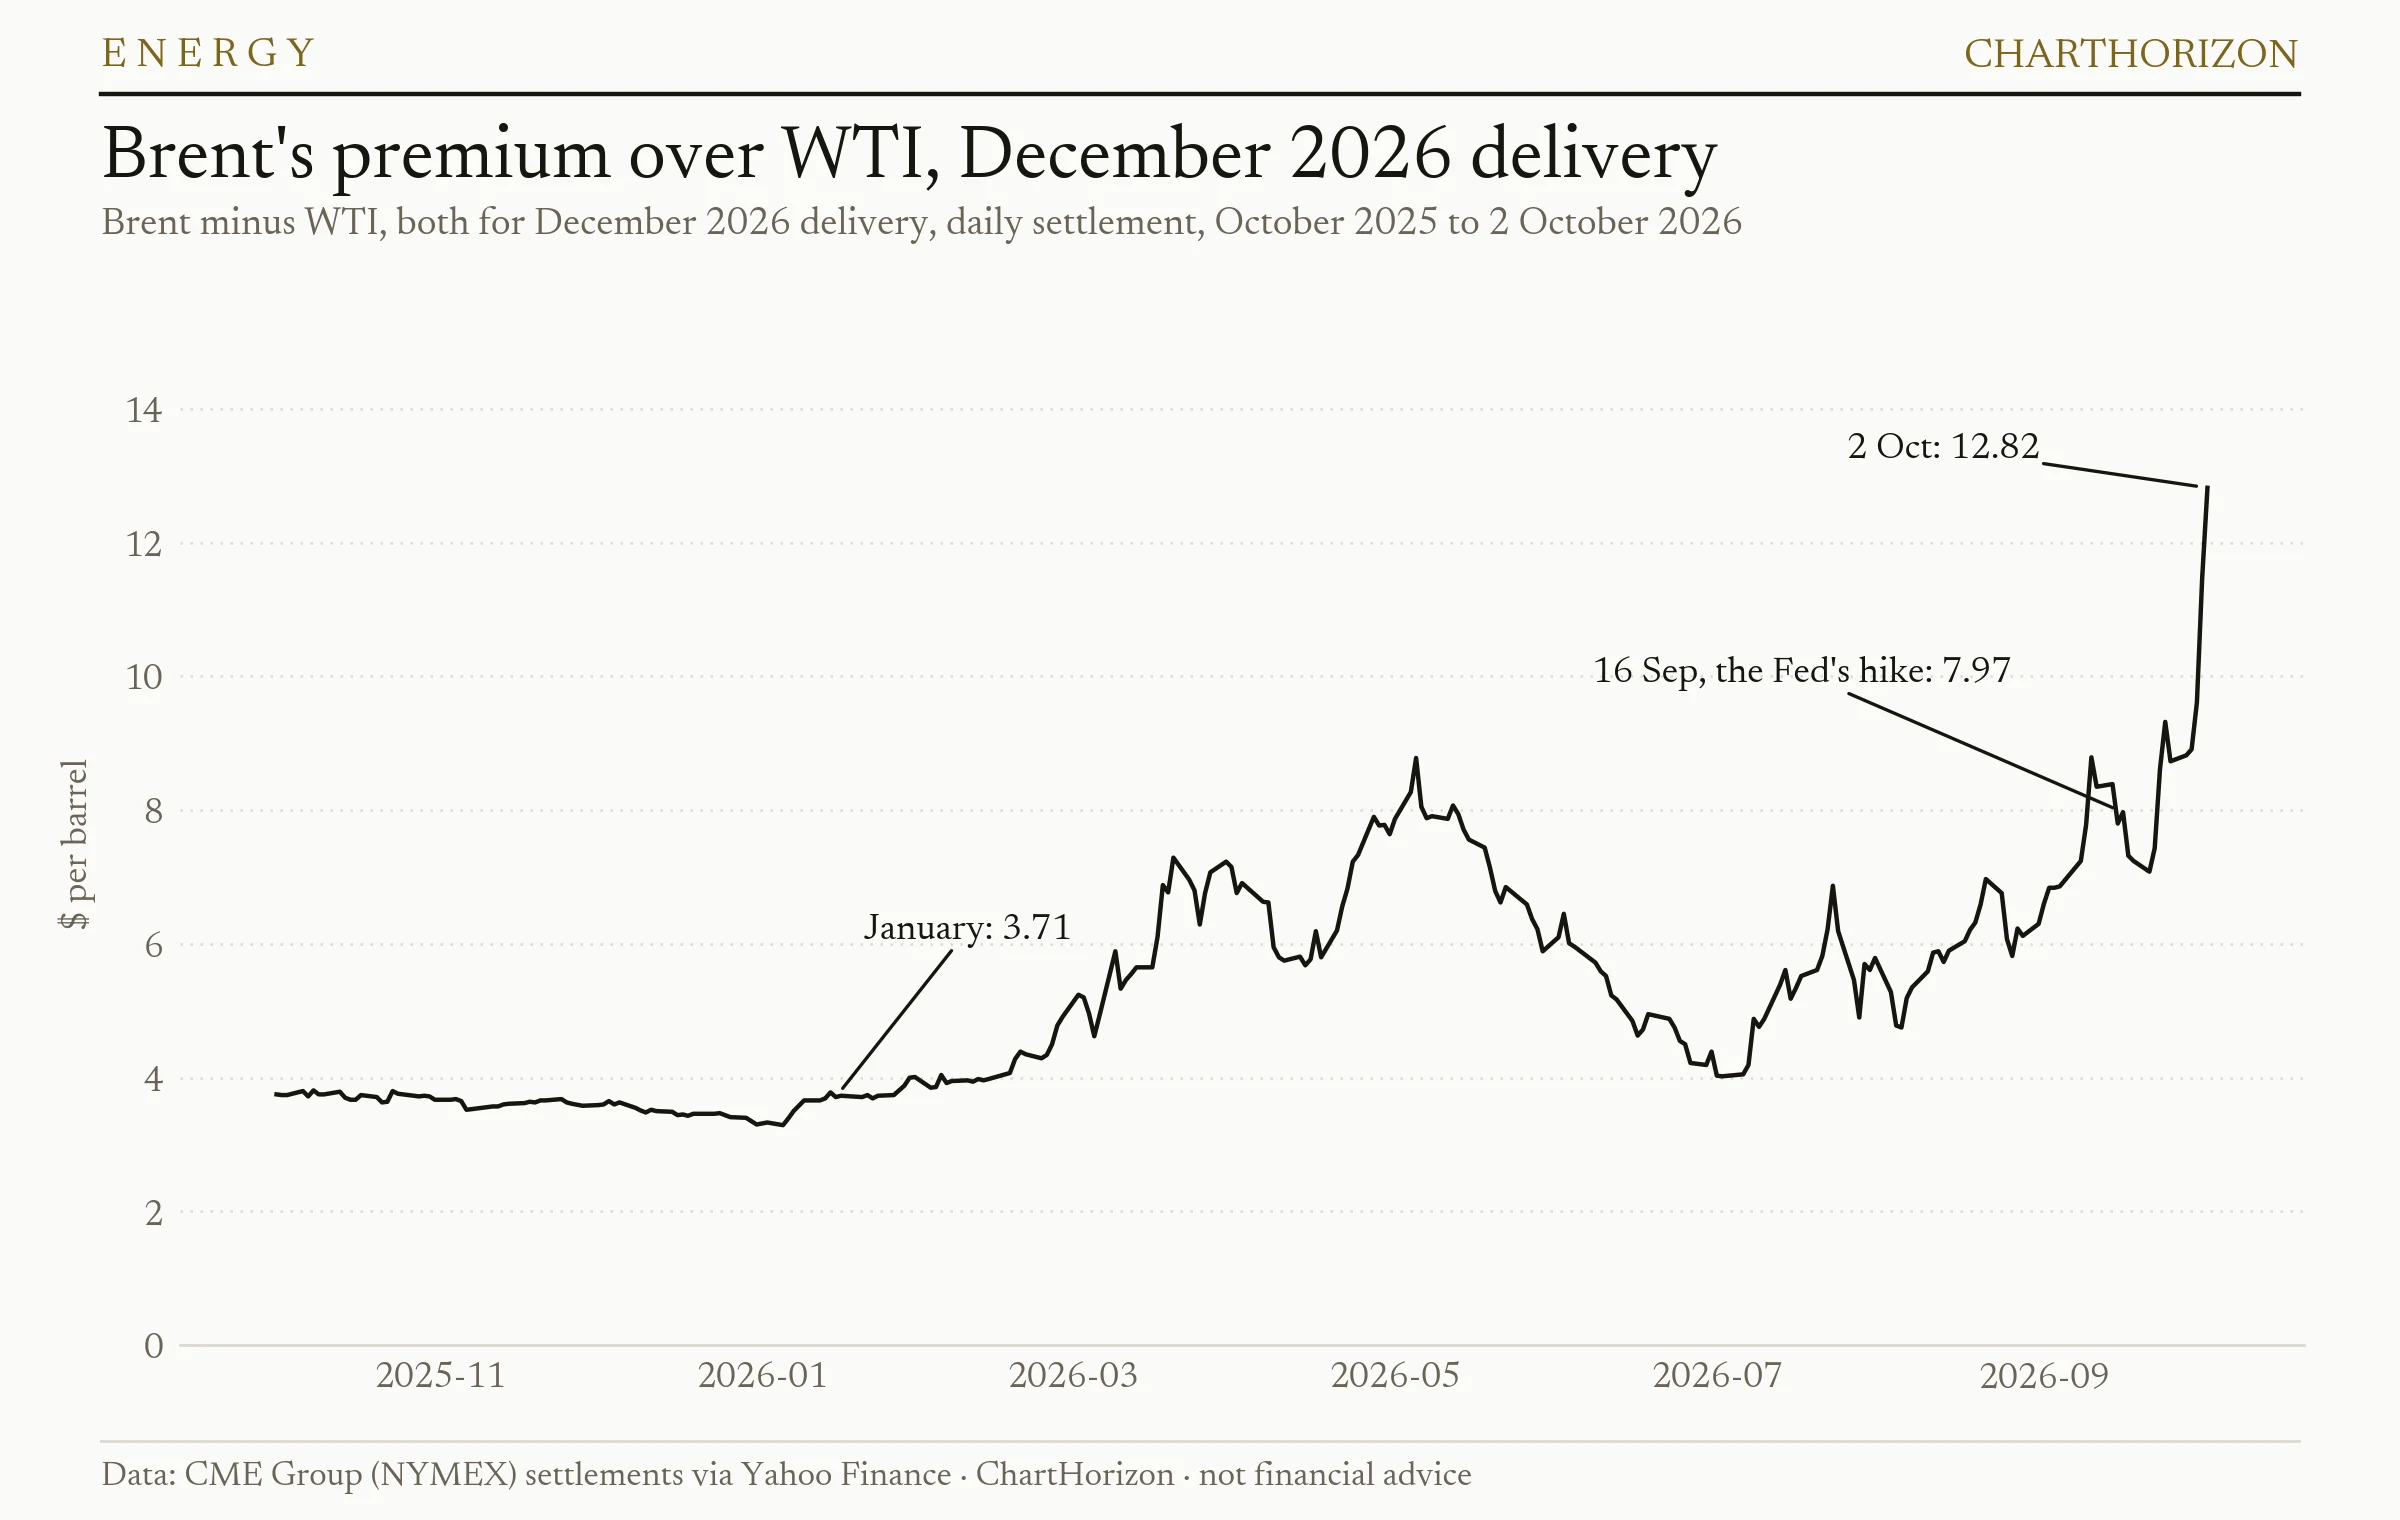
The fall at the front is an American fall. Since the hike December WTI has lost $3.36, while December Brent, the seaborne barrel that Europe and Asia pay for, has gained $1.49 and stood at $102.25 on Friday.
Until Tuesday the two moved together, and the gap between them ended that day within a dollar of where it had started. Then they parted. On Thursday the carrier news added $4.28 to December Brent and $2.42 to WTI. On Friday the G7’s statement took $1.41 off WTI and six cents off Brent. December Brent had stood $3.71 above December WTI in January and $7.97 on the day of the hike. It finished the week $12.82 above, the widest gap in the twelve months of prices the desk has for the pair, and $3.91 of that came in the last three sessions.
The reserve’s barrels are American ones. The last tranche comes out of Big Hill and Bryan Mound on the Texas coast, and the shortage it answers is in the seaborne market. So the $91 on American screens is partly a local price. The war premium sits on the other benchmark.
What the four tests say
- The back of the curve stays put. Not met, but it moved the way the test was watching for. December 2027 rose $3.01 to $75.56, still $4.44 short of $80, and the front did not hold: it fell. The 2027 average did cross $80. That was not the test, and it is noted only because it is roughly the price at which a producer could sell next year’s output today.
- The long-run inflation rate stays below its high. Holding, just. The five-year, five-year forward fell to 2.31 per cent on the day of the hike, was back at 2.35 two sessions later, and has stayed between 2.33 and 2.36 since. It closed at 2.36, a new high for the year, on four days. One basis point is not “clearly above”, so the test is not called, but the hike has not brought it down either. The ten-year Treasury yield rose 23 basis points through Thursday, 20 of them in the inflation-protected real yield and 3 in breakeven inflation. The bond market charged more for money, not for inflation.
- The spread narrows when the pipeline returns. Met. The December-January spread was $3.88 on 16 September, $2.28 on the day the pipeline restarted, $1.54 on 29 September and $1.61 on Friday, against the $1.50 it showed in August. To that extent the shortage it measured was the pipeline’s. Brent’s equivalent spread narrowed too, from $4.07 to $2.65 by Tuesday, but was back at $3.54 on Friday after the carrier news.
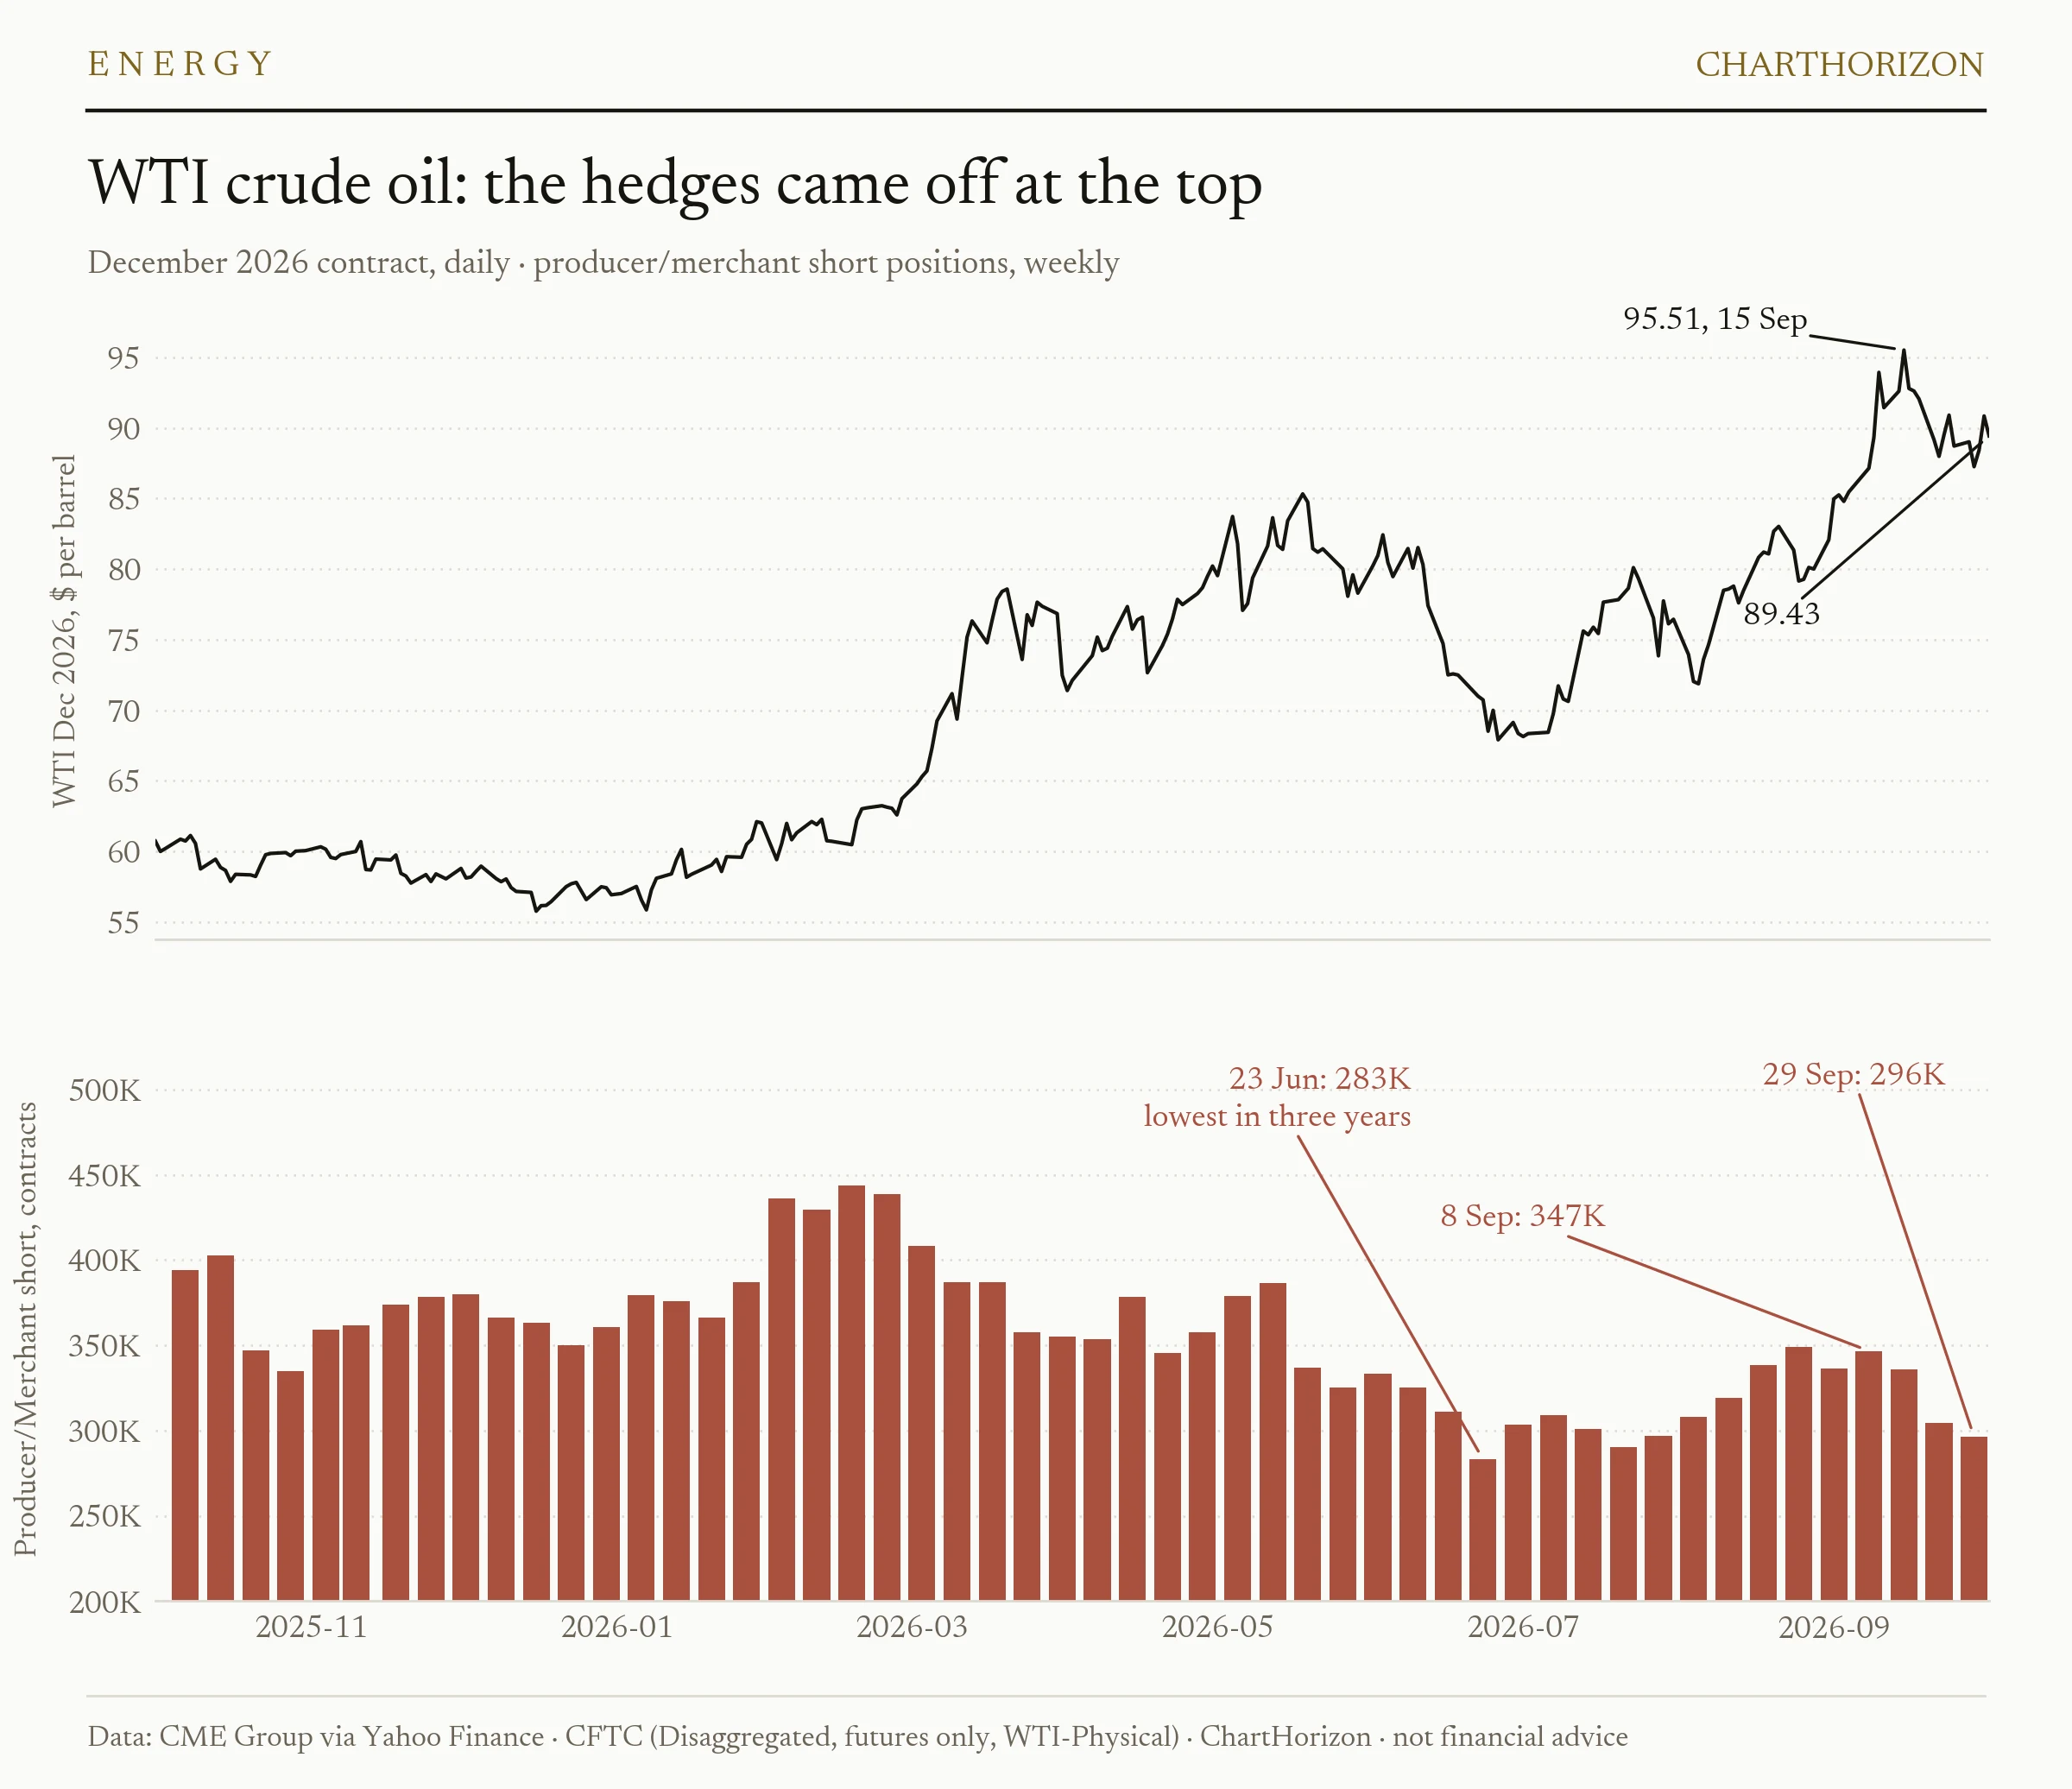
- The hedgers sell at $100. They did the opposite. The producer/merchant short book fell from 346,775 contracts on 8 September to 335,812 in the report dated 15 September, the first after the $100 break, then to 304,558 and 296,348. That is the fifth-smallest of the 157 weekly reports since October 2023. Part of the second drop is the October contract’s expiry, which closes positions on both sides, and the long side fell by about as much that week. The other two weeks are not explained by it. By the test’s own terms, the producers did not say they expected $100 to last.
Taken together, the read of two weeks ago holds at the front and has slipped at the back. The shock is passing, more slowly than the curve priced on 16 September.
What would change this read
- The last tranche finds borrowers. Bids for the final 40 million barrels close on Tuesday, 6 October. A full award at this flatter curve says the exchanges still pay. A short one says the curve has flattened to the point where borrowing no longer does, which also removes one source of buying at the back.
- December 2027 goes through $80. The same line as two weeks ago, because it is still the right one. The contract is at $75.56 and has risen in nine of the twelve sessions since the hike.
- The Brent-WTI gap closes when the American deliveries end. The last tranche goes out in November and December. If December Brent still stands near $12 over WTI once it has, the gap is about export capacity and the shortage abroad, not about the reserve.
- The five-year, five-year forward closes above 2.40 per cent. The Fed’s next decision is on 28 October. A close at that level before then would mean the hike has not bought what it was meant to, whatever oil does in the meantime.
The read
Two weeks ago the curve said the shock would pass, and the Fed bought insurance that it would. The front of the American curve has since done what that read expected, for reasons that are easy to name: a pipeline back in service, more ships through the strait, and a reserve opening on the Texas coast. The seaborne barrel has not followed.
The back did not wait, on either side of the Atlantic. Some of that is a war that looks longer than it did. Some of it is arithmetic: the barrels pulling this winter’s price down are owed back, with interest, in the months that rose, and the hedgers did not lock in $100. Emergency stocks can move a shortage in time. They cannot make it disappear, and on a futures curve the bill shows up on the right-hand side.
Informational and educational only — not financial advice. Futures trading involves substantial risk of loss; seasonal and positioning signals do not guarantee future results. Signals and charts: ChartHorizon (local end-of-day data).