Failure to Confirm
The 30-year yield broke its 2023 peak; the 10-year did not. Grains, currencies and stock indices refused to confirm in the same week, days before the Fed.
Prices through 11 September 2026 · COT through the 8 September report · an intermarket note · Data: ChartHorizon, CFTC, U.S. Treasury, USDA & press reports · Charts: ChartHorizon
The oldest rule in Dow Theory is also its simplest. When one member of a family makes a new extreme and its siblings decline to follow, the move is unconfirmed — and an unconfirmed move is where trends tend to run out of road.
This week four families disagreed with themselves at once. The thirty-year bond made a new low that the ten-year and the two-year refused. Soybeans made a new high that corn and wheat refused. The euro and the pound made new lows that the dollar index refused. The S&P 500 and the Dow made new lows that the Nasdaq 100 refused.
One at a time, each of those is a detail. Together they lean the same way, and it is the opposite of the way every headline leaned this week. What follows is the four charts, what is actually inside each of them — in two cases rather less than the picture suggests — and the one market that has not disagreed with anything.
The case the news made
On the news, the week closed the case for the summer’s trade. August consumer prices rose 0.4 per cent on the month and 3.4 per cent on the year; core prices rose 0.3, a tenth more than forecast; and the energy index now stands 16.3 per cent above a year ago. CME’s FedWatch tool moved to odds of nearly nine in ten on a quarter-point hike this Wednesday. On Thursday the European Central Bank raised its deposit rate to 2.50 per cent, its second increase since the war with Iran began, and all 52 of the Bank of Japan watchers surveyed by Bloomberg expect a hike to 1.25 per cent on the 18th. Brent touched about $108 on Thursday. Oil has risen more than eighteen per cent in September alone.
And on Thursday the thirty-year Treasury yield closed at 5.37 per cent — above the 5.35 it reached in June 2007, on the Treasury’s own daily curve.
Inflation rising, central banks hiking, long yields through a pre-crisis peak. Every one of the charts below was drawn in that same week.
The long end signed alone
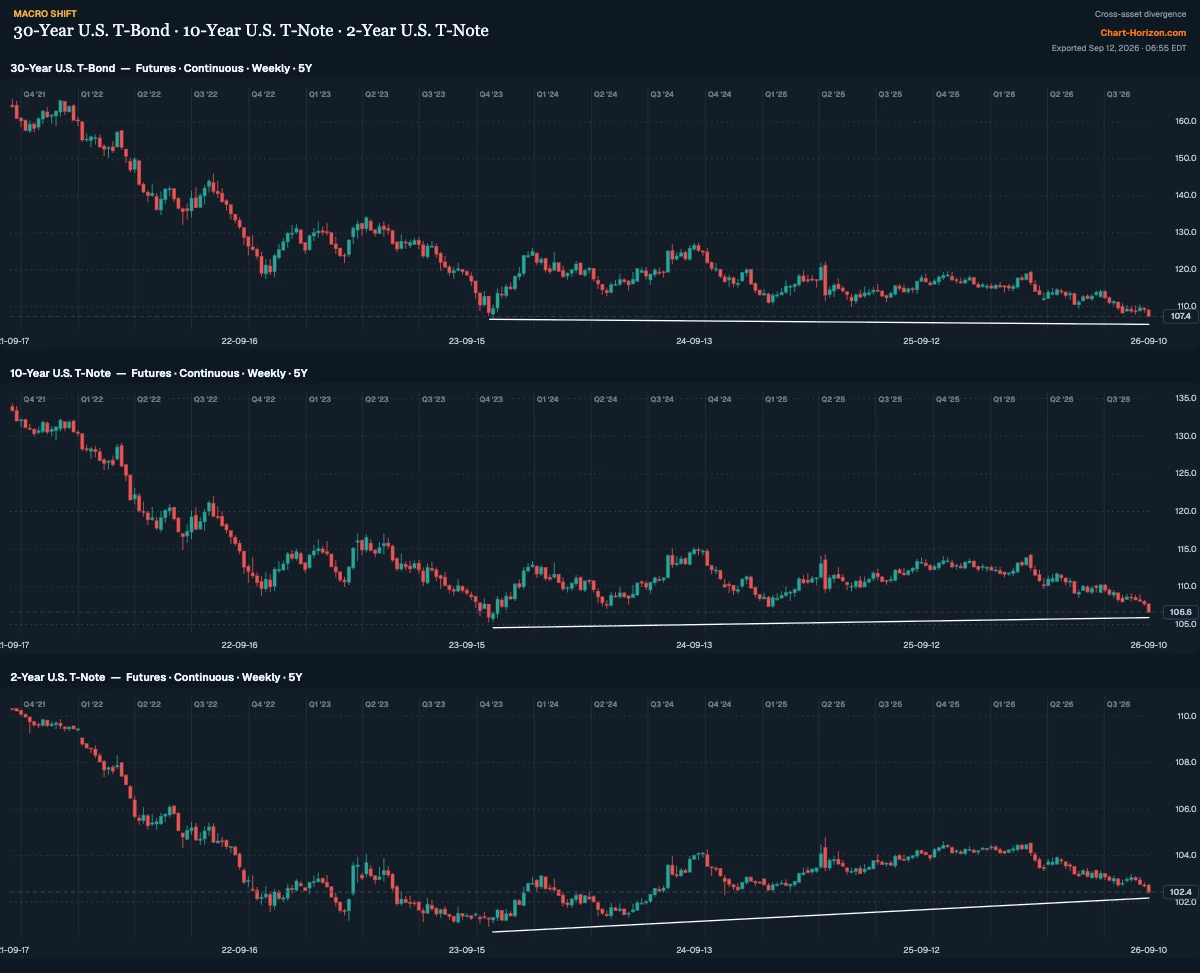
Measured in yield — the cleaner comparison across three years of contract rolls — the break sits on one line only. The thirty-year closed Friday at 5.35 per cent, 24 basis points above its October 2023 peak of 5.11. The ten-year closed at 4.96, its highest since that October and still two basis points short of the 4.98 it set then. The two-year closed at 4.63, 56 basis points under its own 2023 peak.
The two-year’s refusal needs a discount before it counts. In October 2023 the funds rate stood at 5.25–5.50 per cent; today it is 3.50–3.75, and a two-year note trades the funds rate. It could hardly have made a new high. The ten-year has no such excuse, and the ten-year is the one that matters: it is the benchmark that mortgages, corporate debt and equity valuations are priced from, and in the week the thirty-year went through its 2007 peak, the ten-year stopped short.
More telling than the levels is the shape of the week. Friday to Friday, the two-year yield rose 26 basis points — its biggest week all summer — the ten-year 18, and the thirty-year 11. On 28 August this desk described the wrong end of the curve: a summer in which the damage scaled with duration and the two-year barely moved. This week ran the other way. The front end did the selling, which is what a market does when it believes a central bank is about to act, and the long end — where the fear of inflation is actually stored — rose at less than half the pace. The gap between the two-year and the thirty-year has narrowed from 108 basis points on 14 August to 72, the narrowest since 22 June.
The hedgers were already there. In the commitments report dated Tuesday 8 September — before the inflation data, before the ECB — the commercial book in the thirty-year added 25,604 contracts to 137,912 net long, the 96th percentile of three years and one of the three new highs Friday’s Ledger flagged. It is the same book that flipped long in late April and has stayed long since, bar one week at the end of June, through the whole of this summer’s selloff.
The last grain to make a high
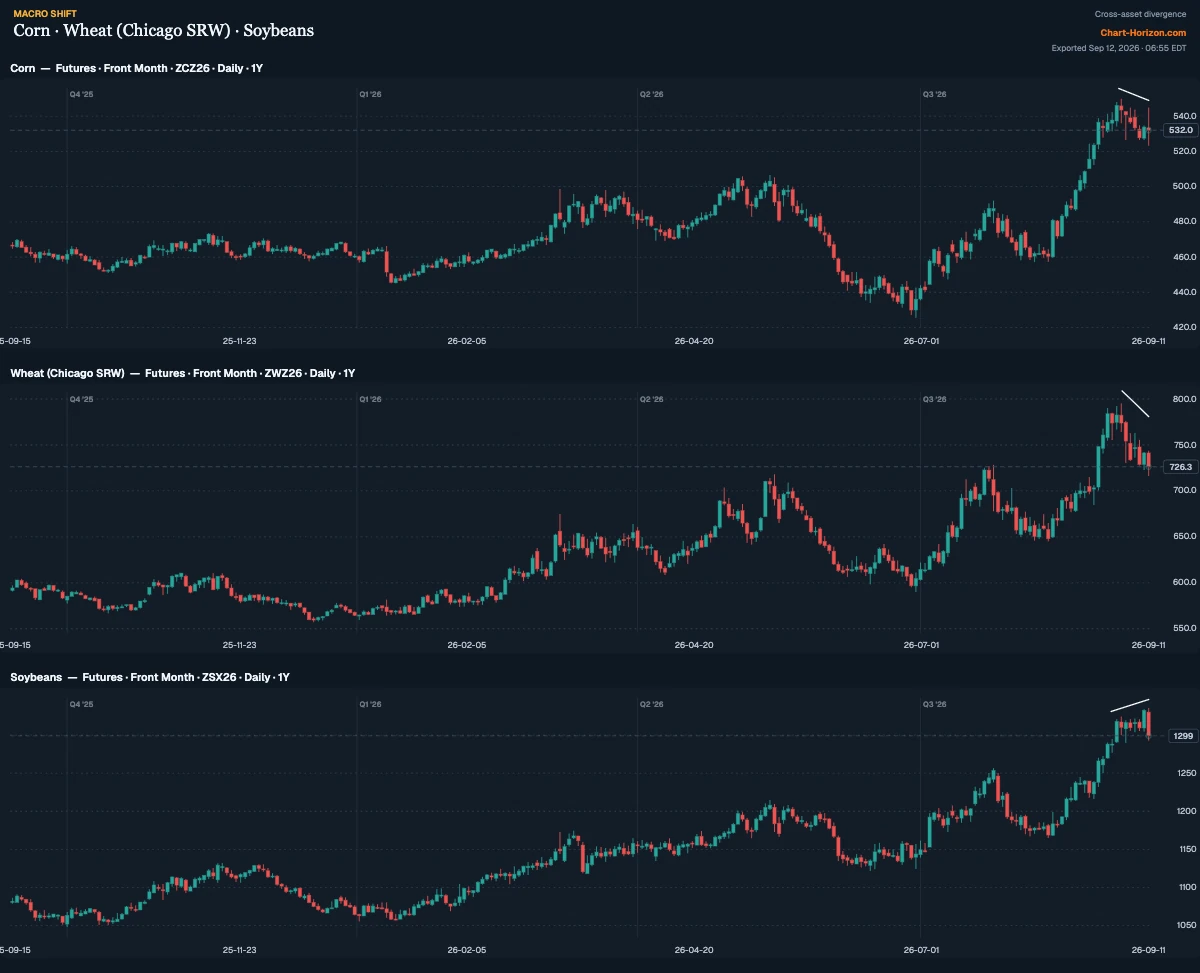
The grain rally was real, and it had reasons. A sudden escalation in attacks on Black Sea shipping lanes and port infrastructure in mid-July constrained the world’s wheat supply, and the US corn crop entered September with 56 per cent rated good to excellent, its weakest start to the month in three years, DTN reported. On 28 August corn and wheat traded at their highest prices in more than three years. December corn rallied almost ninety cents from the August crop report to its early-September peak.
For two of the three, that peak came on 2 September. December wheat set 795 that day and has not traded above 776 since; it settled Friday at 725¼, 8.8 per cent below the top. December corn set 549¾. On Friday it tried again, reached 544¾, and settled at 530¼.
Soybeans kept going. November beans made 1324 on 2 September, 1333½ on Thursday and 1335¼ on Friday — the day the Department of Agriculture published its September estimates. All six headline numbers for corn and soybeans, yield, production and ending stocks for each, came in above the trade’s estimates. The soybean yield was put at 52.8 bushels an acre against 52.5 expected, raised from August’s 52.7 when the trade had pencilled in a cut, and soybean ending stocks at 310 million bushels against estimates of 290 to 298. November beans settled at 1296½, down 35¾ cents. The day’s high was above Thursday’s high and its close was below Thursday’s low: an outside reversal, printed by the last member of the family still making new highs, on the day the supply side stopped cooperating.
The commitments data needs reading with some care here. In the report dated 8 September the producer/merchant book sits at the 1st percentile of three years in all three markets — hedgers selling forward into the highest prices in years, which is their job. As the Ledger put it, a short that deep describes the rally more than it predicts its end. What is worth noticing is the direction of the latest week. In corn and wheat, the two that had already stopped making highs, the hedgers bought back about 19,000 contracts each. In soybeans, still rising, they sold another 5,587.
Who refused on the dollar’s behalf
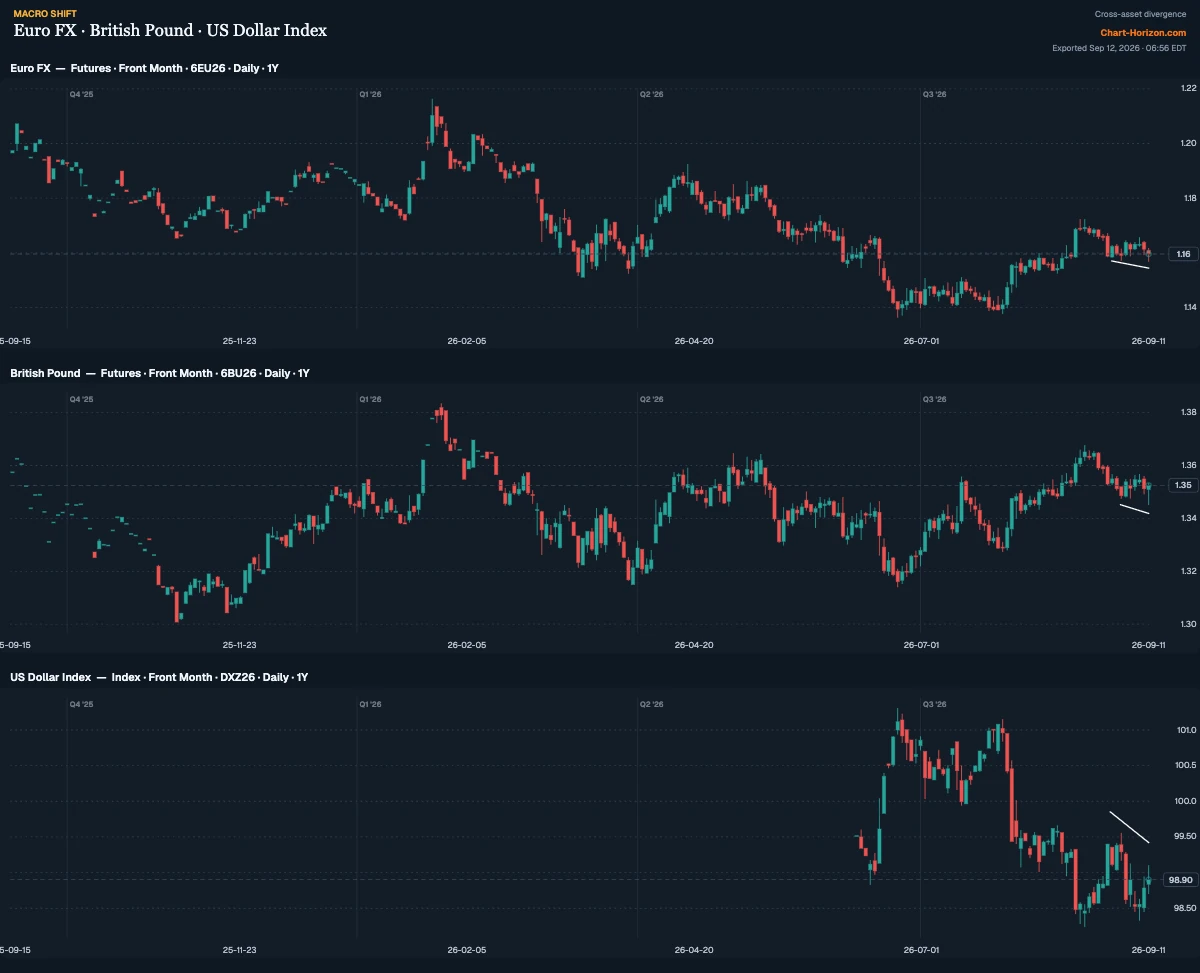
The euro’s September contract made 1.1572 on 2 September and 1.1567 on Friday. The pound made 1.3475 and then 1.3451. Two lower lows, in the euro and the pound, and so a dollar index that should have made a higher high. It did not: the December contract topped at 99.555 on 2 September and could reach only 99.10 on Friday.
This is the divergence that needs the most care, because the index has six members and the chart shows two. Take the dollar index from its close on 2 September to Friday’s: down 0.44 per cent. The euro, 57.6 per cent of the index, accounts for about 0.03 of that. The pound accounts for about 0.03. The franc and the Canadian dollar pushed the other way. The yen — 13.6 per cent of the index, up 3.3 per cent against the dollar in six sessions, from 158.78 to 153.70 — accounts for about 0.45. Almost the entire refusal is the yen, and the yen is rising for one reason: a Bank of Japan hike next Friday that the market has close to fully priced.
So the honest version of this chart is narrower than it looks. The currency whose central bank raised rates on Thursday made a new low on Friday. The desk’s own strength board, dated 11 September, still has the dollar as the second-strongest of the eight majors at +2.3, and puts both the euro (−0.9) and the pound (−1.6) below the line. And the yen’s own hedgers went the other way: the report dated 8 September has their net position down 111,602 contracts to 14,041 net short, the largest one-week move in the archive — the reversal the Ledger set against the test this desk had called met the week before.
Where the positioning does lean with the chart is everywhere else. Commercials in the euro and the pound sit in the top fifth of their three-year ranges, and in the dollar index in the bottom eighth.
The index that should have broken first
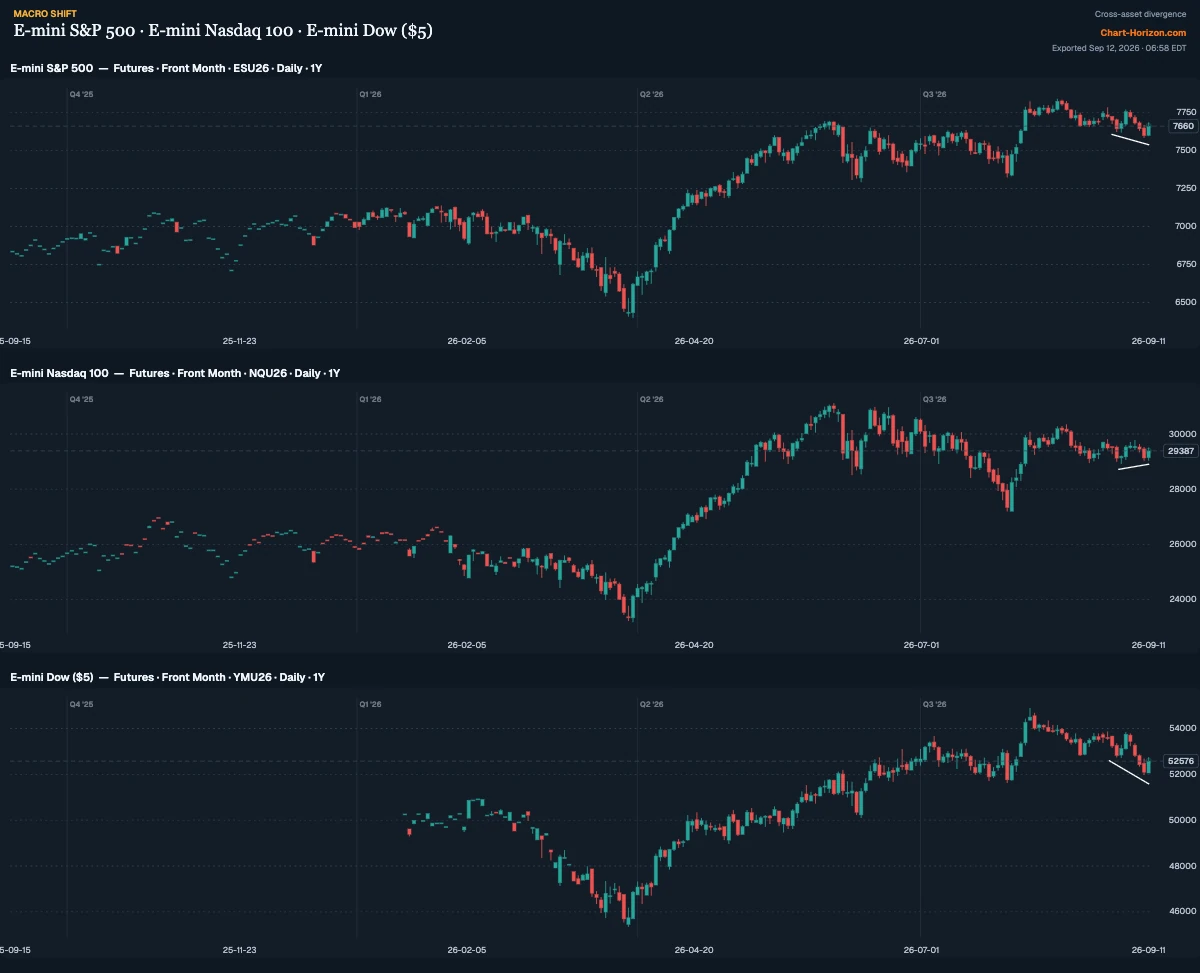
The September S&P contract made 7,618½ on 2 September and 7,585½ on Thursday. The Dow went from 52,720 to 51,992. The Nasdaq 100, having made 28,927¼ on 2 September, held at 29,040½.
What makes that worth a paragraph is which index held. On the usual reading the Nasdaq 100 is the most rate-sensitive of the three: its valuations rest furthest in the future, which makes it the equity market’s version of a long bond. In the week the thirty-year yield went through its 2007 peak, the index that should have broken first is the one that did not break. On Friday stocks snapped a four-day losing streak as oil eased and the inflation report landed close to expectations, the S&P 500 closing up 0.9 per cent at 7,656.98. On the week it still lost 0.8 per cent, and the Dow 1.6.
Here the positioning is no help, and it should be said plainly. The commercial books in all three index contracts sit in the lower third of their three-year ranges, the Dow’s in the bottom eighth. If the stock half of this argument is right, it is right on price alone.
The one that has not signed
Put together, the four divergences describe one possibility: that the summer’s regime — commodities up, long yields up, the dollar firm, equities under pressure — is beginning to turn into its opposite. In the chain John Murphy laid out in Intermarket Analysis, which sits on this desk’s reading-room shelf, falling commodity prices are good for bonds, and rising bonds are good for stocks. This week the first link and the last refused the trend together, and the bond market in between has begun, at the long end, to take the central banks at their word.
There is a hole in that reading, and it is the size of the energy complex. Grains are not what is driving this inflation; energy is. Brent rose 8.7 per cent on the week and WTI 9.4, with Thursday’s highs at about $108 and above $104. The hikes being priced this week — at the Fed on Wednesday, and delivered by the ECB on Thursday — are oil’s hikes, and a commodity top that does not include oil is a grain top, not an inflation top.
Oil did give ground on Friday. Brent settled 2.8 per cent lower at $104.61 and WTI 2.4 per cent lower at $100.05, ending runs of five and eight straight gains, after Iranian state media said Tehran would meet Gulf states in Oman to discuss the Strait of Hormuz. That is one headline and one session. The four charts above are the market voting on a turn. Oil has not voted.
What would confirm it
In August this desk named two conditions for the yen in advance and came back to report on both. The same standard applies here: five things, each checkable, each capable of failing.
- The ten-year stays under 4.98 per cent. A close above its October 2023 peak confirms the thirty-year’s break and ends the bond divergence outright. It is two basis points away, and the Fed decides on Wednesday.
- November soybeans stay under 1335¼. Friday’s outside reversal is only a top if its high holds.
- The dollar index still cannot make a higher high once the Bank of Japan has delivered. If the refusal is only the yen pricing a hike, it should fade after the hike on the 18th. A December contract through 99.555 confirms the euro’s and the pound’s lows and ends this part of the argument.
- The Nasdaq 100 holds its 2 September low through Wednesday while the other two stay below theirs. The September contracts expire on the 18th, so the test has to be passed before then.
- Oil follows the grains. Brent back under $100 would be the first sign that the commodity actually driving the inflation has joined the turn. Without it, the other four are a sector story told in four markets.
The read
None of this says the turn has happened. Every piece of news this week argued the other way, and the news may simply be right: a Fed that hikes on Wednesday into 3.4 per cent inflation and $100 oil has more work ahead of it, and the ten-year may yet go through. What the charts show is narrower, and more useful for being narrower. The members of the summer’s trade stopped agreeing with one another in the very week its case was made most loudly.
Markets rarely turn when the news changes. They turn when the last piece of news the trend needed has been delivered, and the thing this week’s headlines had in common is that they all delivered. Wednesday’s hike is nine-tenths priced. The Bank of Japan’s is priced. The ECB’s is done.
The commitments report dated Tuesday 15 September — published on the 18th, the day the Bank of Japan decides — will be the first to show positioning taken after the inflation report and the ECB’s hike. By then the four families will either have settled their disagreement, or it will have turned out to be the first sign that the trade everyone could see had run out of people left to join it.
Informational and educational only — not financial advice. Futures trading involves substantial risk of loss; seasonal and positioning signals do not guarantee future results. Signals and charts: ChartHorizon (local end-of-day data).