Jekyll2026-08-16T01:15:40+02:00https://chart-horizon.com/feed.xmlChartHorizonWeekly futures positioning notes from the CFTC Commitments of Traders report — where season, producer positioning, hedging program and term structure line up. Data: ChartHorizon.ChartHorizonPaid to Wait2026-08-15T00:00:00+02:002026-08-15T00:00:00+02:00https://chart-horizon.com/2026/08/15/paid-to-waitOn Tuesday, 11 August, the producers and merchants who grow and handle American grain were
carrying forward sales near the heaviest end of their three-year range. On Wednesday the
Department of Agriculture cut its corn yield estimate. On Friday Russia dismissed a proposal to
stop shooting at ships in the Black Sea, and wheat closed up three and a quarter per cent.
That is the week in the order it happened, and the order is the whole point. The Commitments of
Traders report published on Friday carries a snapshot dated Tuesday — before the yield estimate,
before the rejection, before the rally. What it shows is a farm sector that had already decided
what this crop was worth.
What the producers filed
Corn · producer/merchant net positioning · ChartHorizon
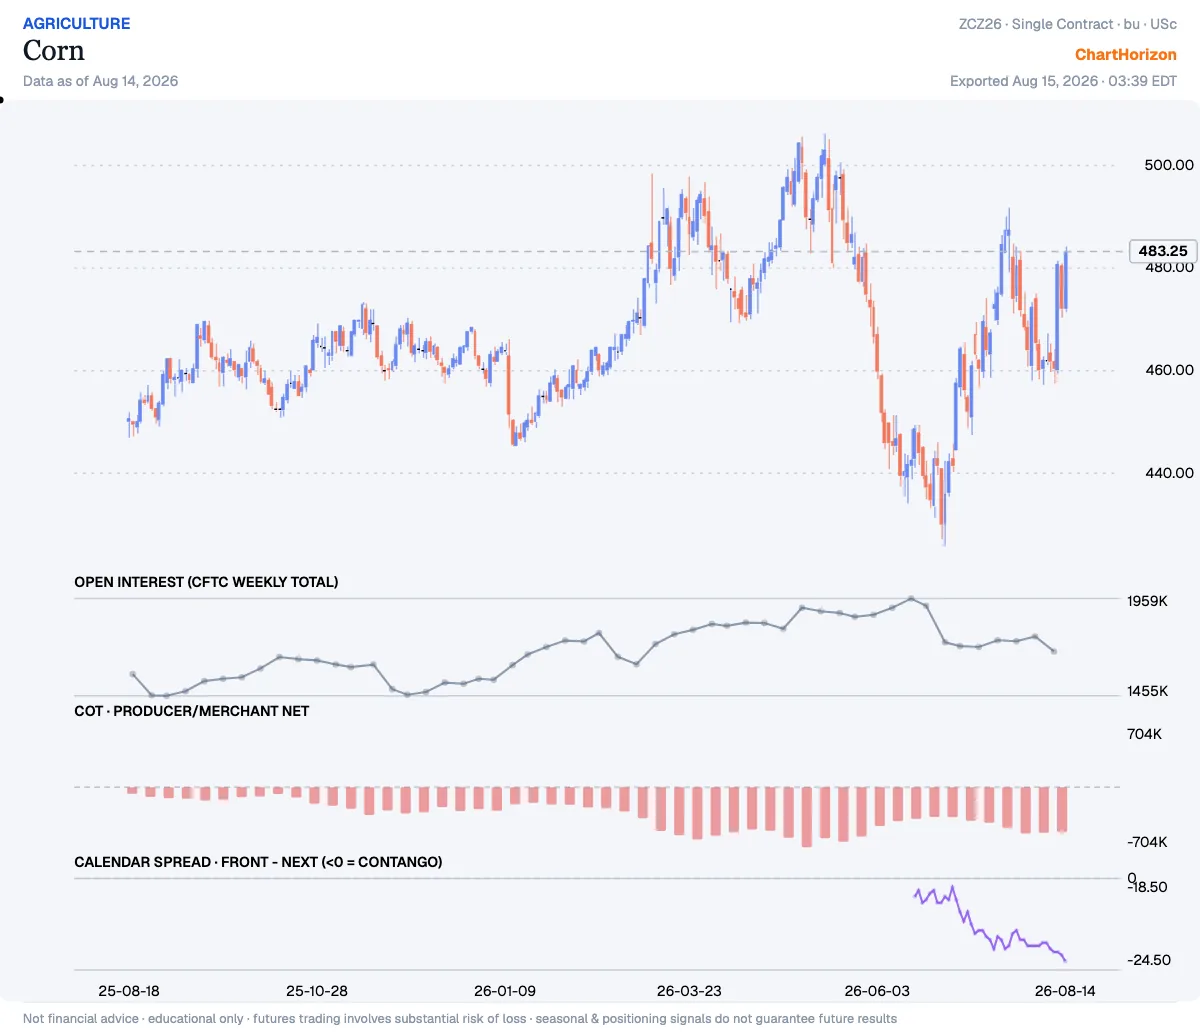
In corn the producer/merchant book is net short 525,668 contracts — the 13th percentile of its
three-year range, which runs from a net short of 713,311 to a net long of 48,600. In Chicago
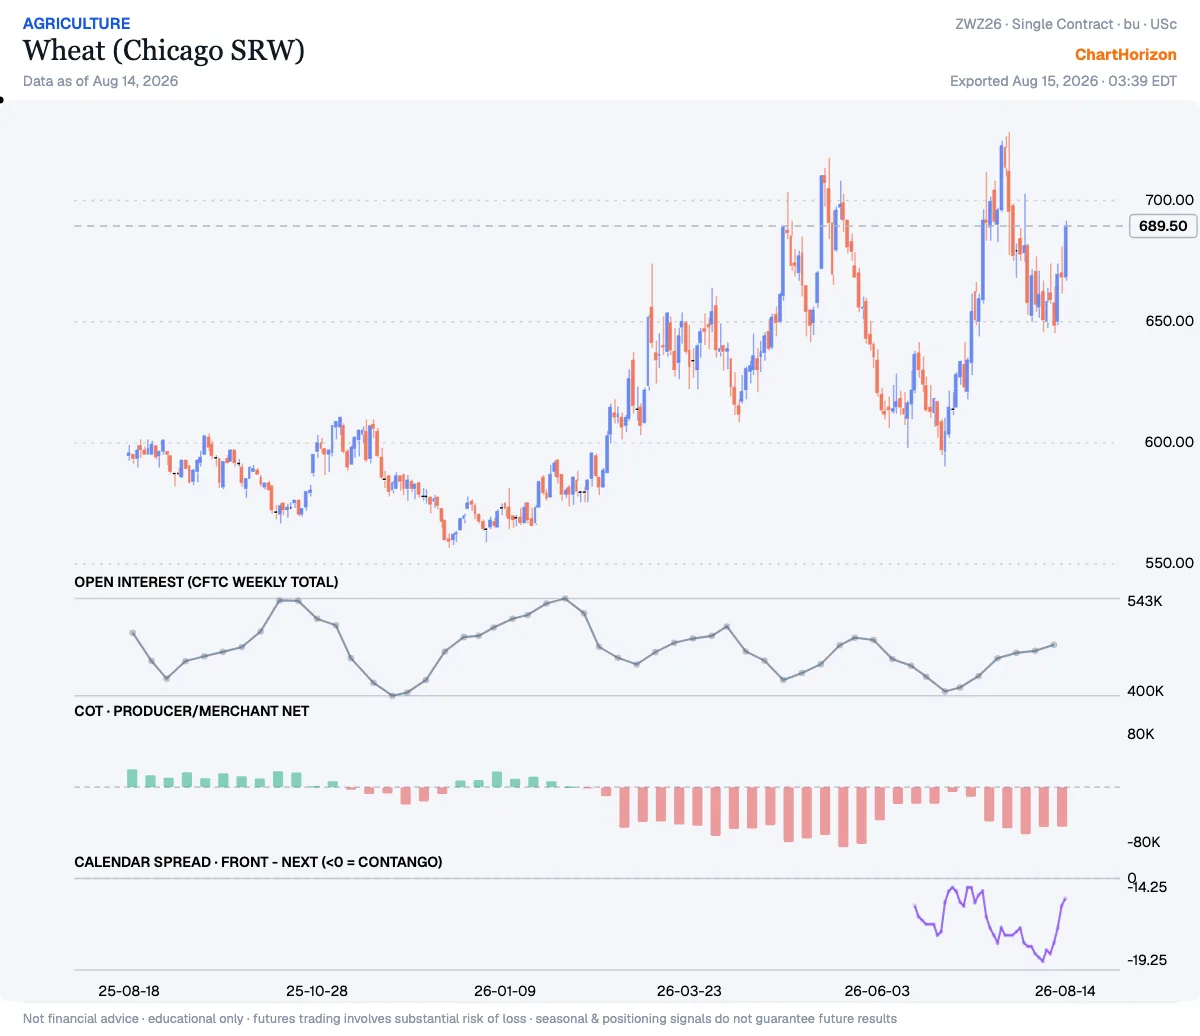
wheat the same cohort is net short 52,632, the 10th percentile. Soybeans sit at the 19th.
Wheat (Chicago SRW) · producer/merchant net positioning · ChartHorizon
None of this is a forecast, and it is worth being precise about why. A grower with a crop in the
field is short the market as a matter of arithmetic. He owns the physical bushel; selling it
forward is how he stops owning the price. Heavy producer hedging is not a bearish opinion. It is
a statement that the price on offer was good enough to stop arguing about.
Cotton #2 · producer/merchant net positioning · ChartHorizon
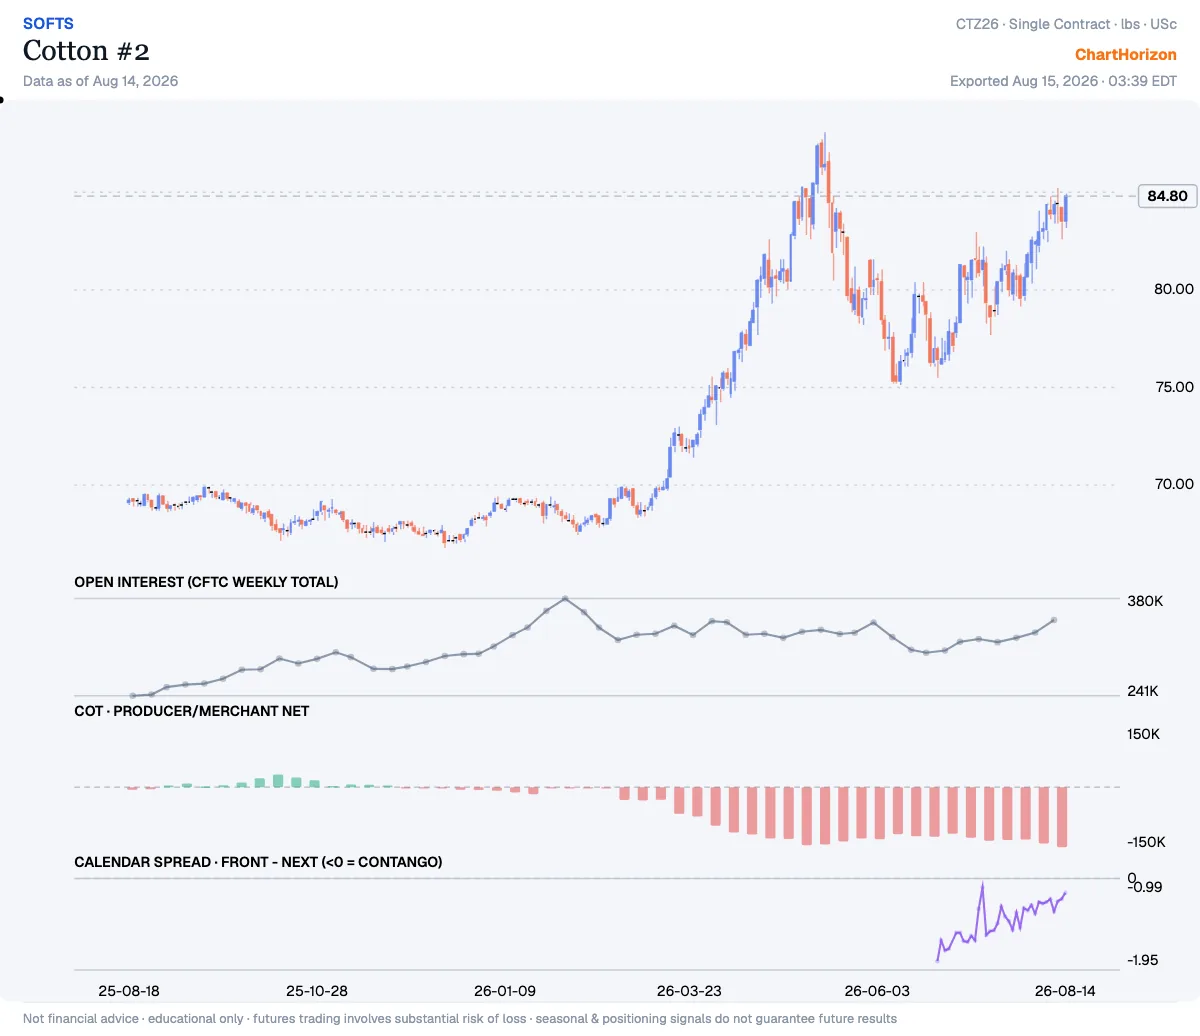
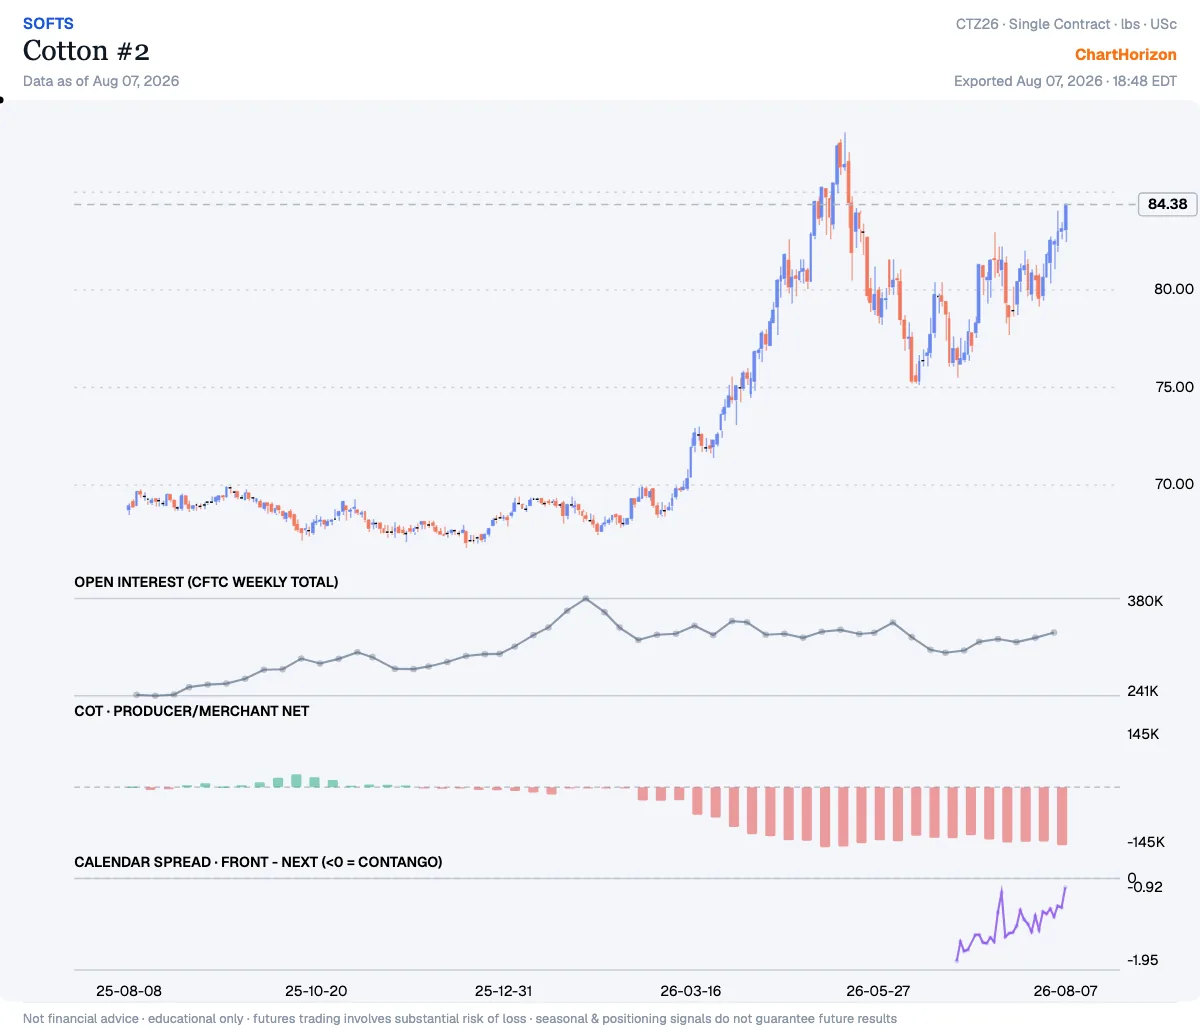
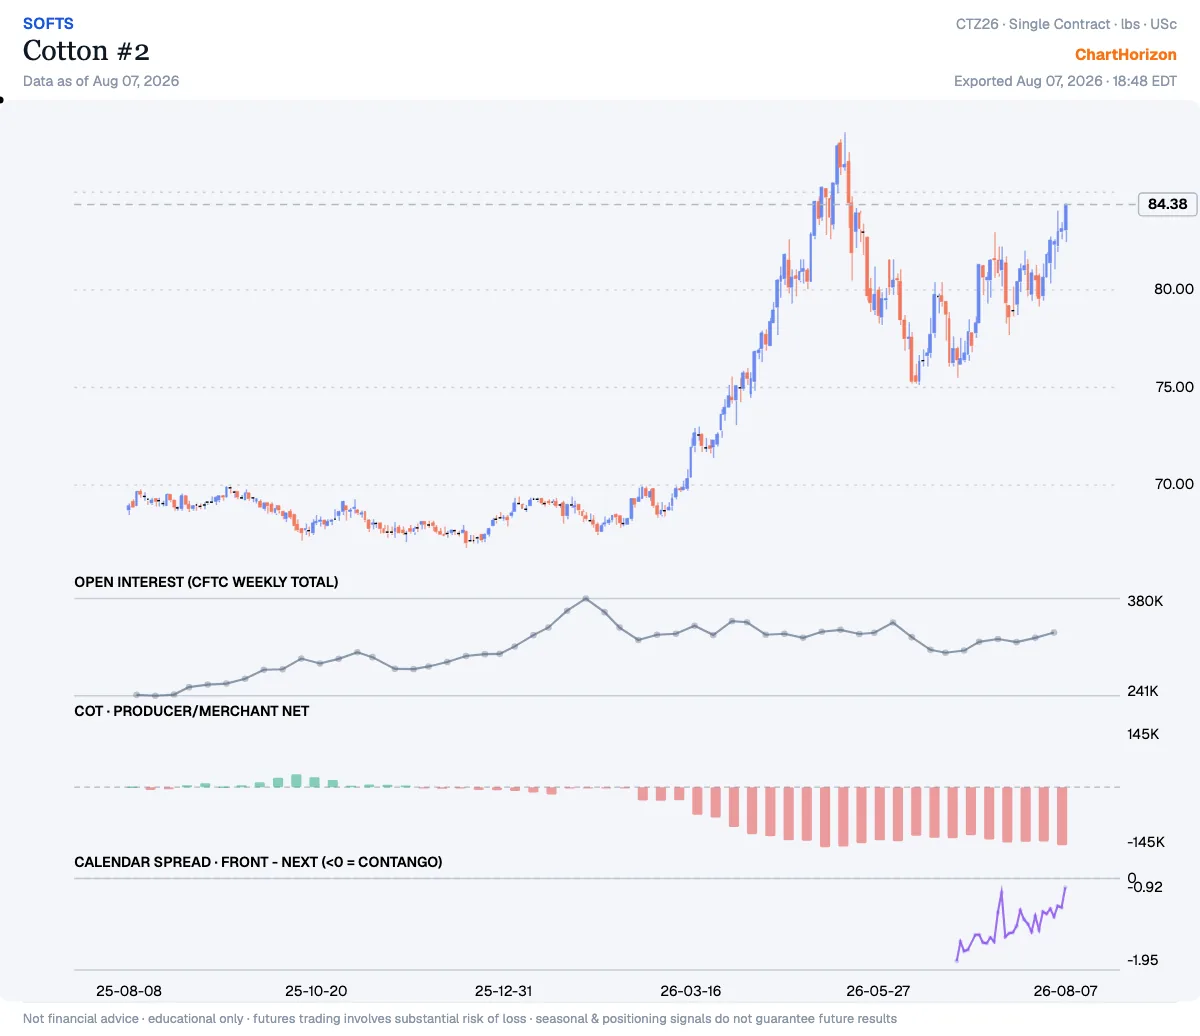
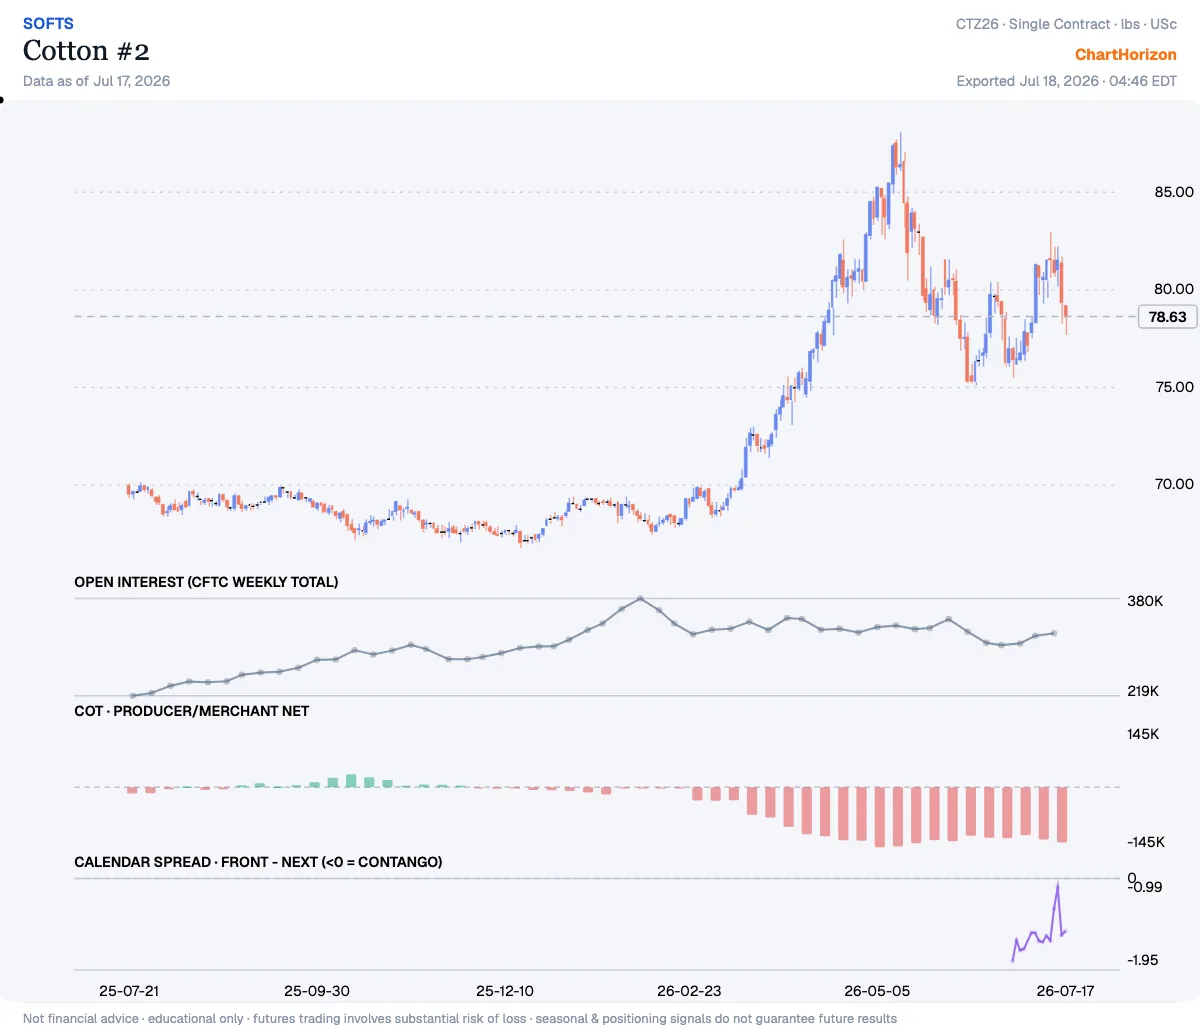
Cotton is the entry that has gone furthest. The producer book there is net short 149,999
contracts — the lowest reading in three years, a fresh record for that window, and deeper than
the 140,793 that appeared in this column a week ago. Growers are hedged into their own crop
harder than at any point since 2023, and the fibre still added better than one and a half per
cent on the week.
What arrived afterwards
Wednesday’s WASDE was the report the whole complex had been waiting on, and it was not the
one-way bullish document the price reaction suggests.
The Department cut its 2026 corn yield to 180.7 bushels per acre, from 183 previously and against
an analyst consensus nearer 182.4. That is the headline, and it is genuinely lower. But the same
report put the crop at 16.0 billion bushels — the second largest on record, and thirteen million
bushels higher than the July figure, because the acreage came up even as the yield came down.
Combined corn and soybean plantings were raised nearly 2.8 million acres against the June
estimate. Ending stocks fell 137 million bushels, to 1.7 billion. Soybean yield came off to 52.7
bushels from 53, yet soybean ending stocks rose ten million bushels to 320 million. New-crop
wheat carryout slipped to 717 million bushels from 722 million.
Read that as a whole and it says: a slightly smaller crop than we thought, on top of a very large
one, meeting demand that is finally rising to meet it.
Wheat had a different and more serious story. Sixty-three per cent of American spring wheat acreage
sat in moderate-or-worse drought in the first week of August, and good-to-excellent condition
ratings fell four points in a week, to 51 per cent. Then the geopolitics. Ukraine had offered to
halt attacks on shipping in the Black Sea; on Friday Russia dismissed the idea and ruled out any
return to the grain corridor of 2022–23. Ukrainian grain exports are running 76 per cent below
last year so far this month, and Kyiv’s own agriculture ministry now projects agricultural exports
falling from 64.4 million tonnes to 29.6 — with corn shipments down 39 per cent and wheat down 26.
September Chicago wheat settled Friday at 674.0, up 21¼ cents. September corn settled at 459¼, up
11¼. Both moved against a positioning read that had been leaning the other way all week.
The curve that did not agree
Here is where the tape says something the headline does not, and it is the reason this note exists.
Both grains rallied. Only one of the two curves believed it.
Wheat’s front-to-next calendar spread began the week at 18½ cents of contango and ended it at 15 —
the front month bidding up against the deferred, three and a half cents of carry taken out over the
week. That is what a supply scare looks like from the inside. When the nearby contract starts
outrunning the one behind it, the market is saying the shortage is now, not next spring.
Corn did the opposite. Its spread went from 23 cents of contango to 24½ — wider, not tighter,
straight through the yield cut. The corn market took the smaller yield, looked at 16 billion
bushels and 1.7 billion of carryout, and asked to be paid more to store it. The full curve says
the same thing without ambiguity: September 459¼, December 483¾, March 499, May 506¾, and July
2027 at 509½. Fifty cents of carry to hold a bushel for ten months is not the shape of a market
that is short of grain. It is the shape of a market being paid to wait.
That distinction is the useful output of the week. The wheat rally has a curve underneath it. The
corn rally, so far, has a headline.
Where the signal argues with itself
An honest ledger includes the entries that spoil the story, and there are three.
The first is that ChartHorizon’s own read was leaning the wrong way into Friday. Both corn and
wheat carried a bearish positioning signal, a bearish hedging signal and a discount term structure
against a neutral seasonal — one bullish factor against two bearish ones, and the market added
between two and a half and three and a quarter per cent anyway. A method that only gets quoted when
it works is not a method.
The second is sugar. Its producer book sits at the 7th percentile, hedged nearly as hard as corn
and harder than soybeans, and sugar fell 1.3 per cent on the day the grains ran. If heavy
producer hedging were a reliable contrarian trigger, it would have fired there too. It did not.
Positioning tells you what the participants have committed to. It does not tell you when.
The third is the calendar. Both grains are days away from the seasonal windows the dashboard
tracks — wheat’s bullish onset falls on 26 August, corn’s on 10 September. A rally that arrives
just before a seasonally supportive stretch is harder to dismiss as noise than one that arrives
against it, and neither of those windows had opened when the producers filed on Tuesday.
Three things would settle this, and none of them requires a forecast.
If the wheat story is real, its carry keeps narrowing and eventually flips — the front bid through
the deferred, the market paying for delivery now rather than storage later. If the corn rally was
a headline, the spread stays wide and the December contract drifts back toward the crop that the
acreage actually produced. And if the producers were early rather than wrong, the next few reports
show them holding those hedges into strength instead of buying them back.
That last one is the entry worth watching, because it is the only one where the people with the
physical crop get a vote. They sold forward on Tuesday, into a market that was about to be told its
harvest was smaller. Everything since has been the tape asking whether they were careless or
merely unhurried — and the curve, for now, is still offering to pay them for the wait.
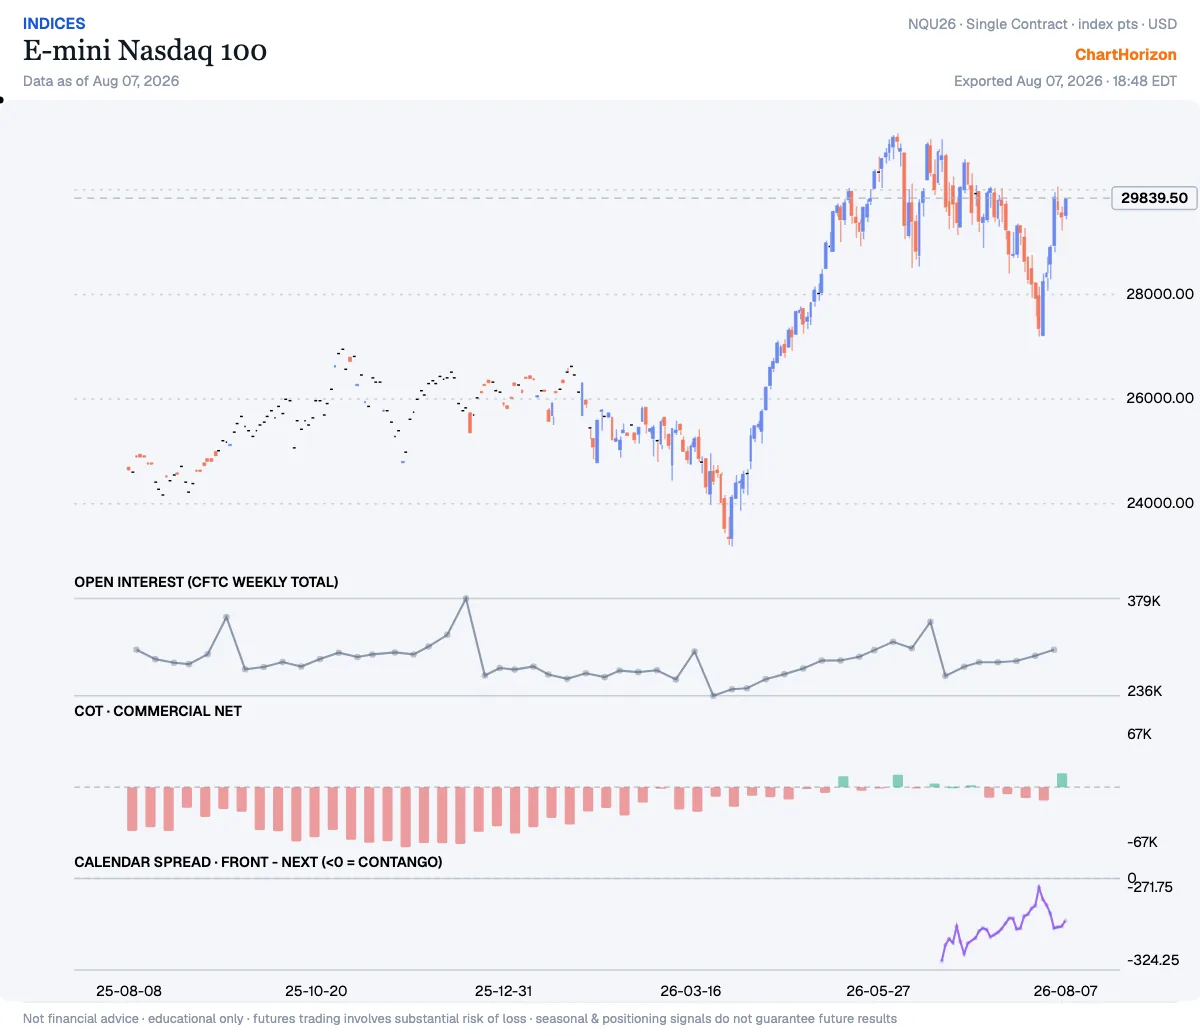
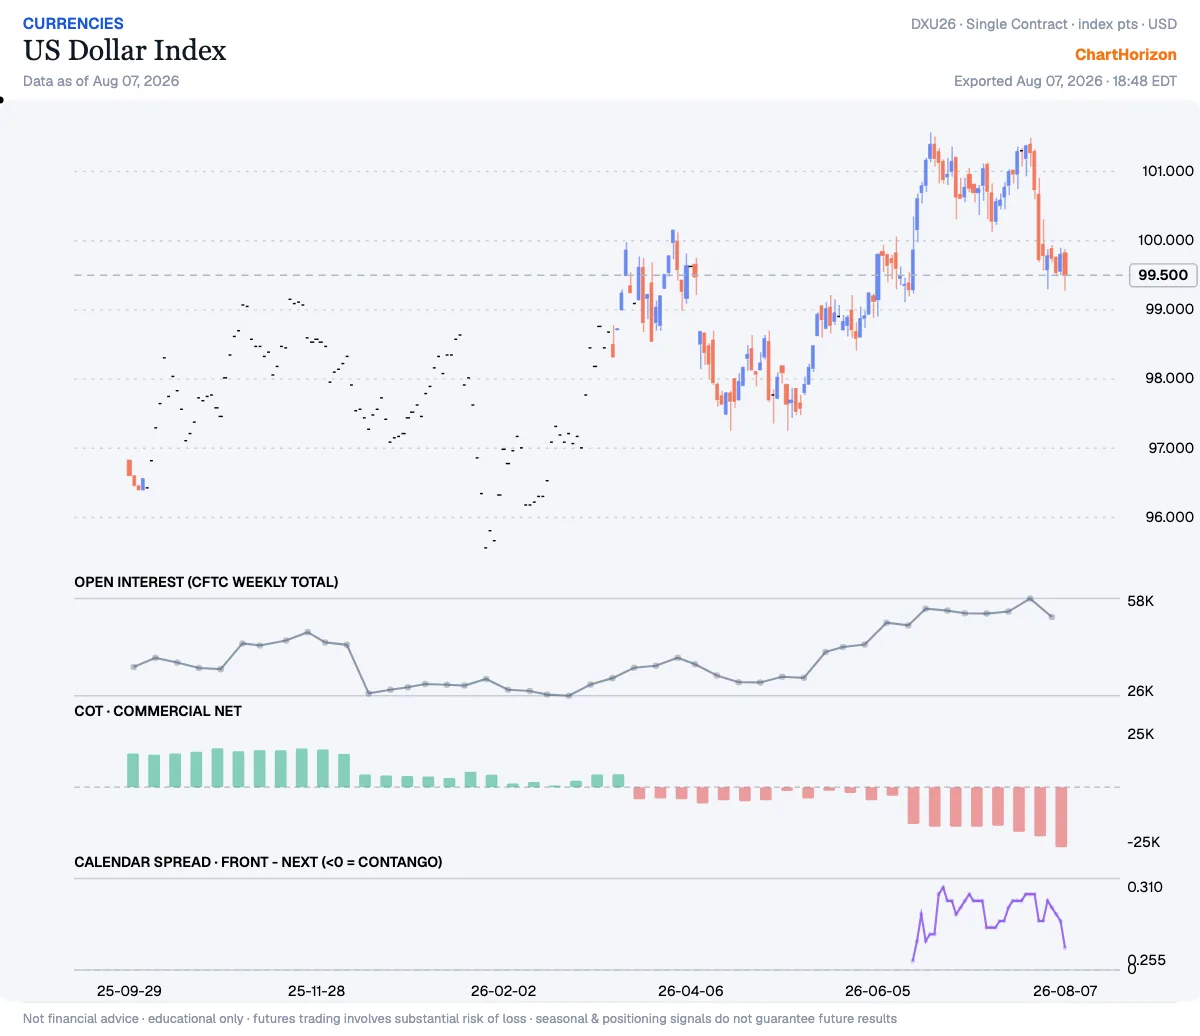
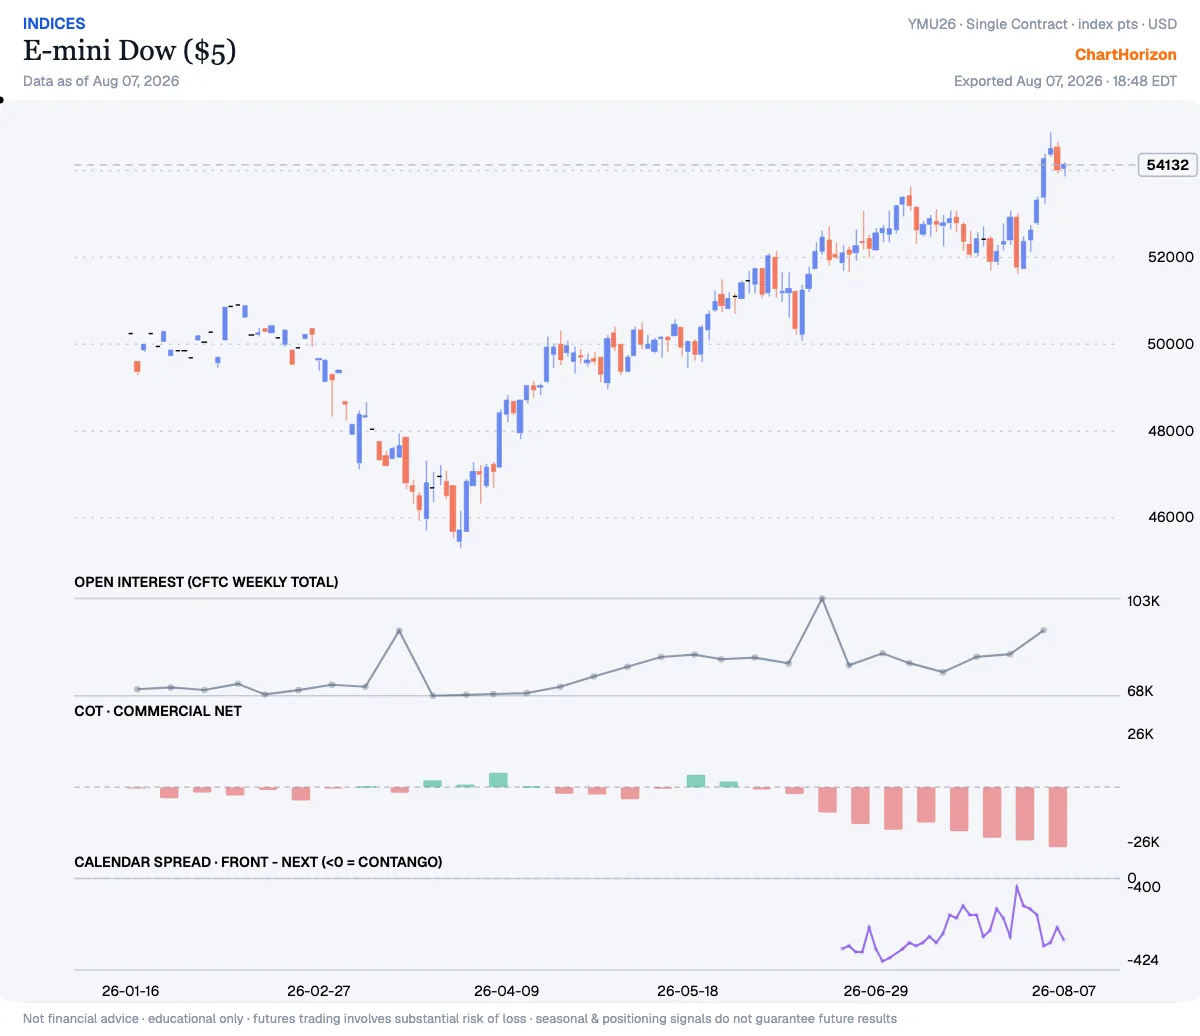
]]>ChartHorizonThe Hedgers’ Ledger — 2026-08-082026-08-08T00:00:00+02:002026-08-08T00:00:00+02:00https://chart-horizon.com/2026/08/08/hedgers-ledgerThe week of 4 August 2026 presents a board that leans decidedly against the dollar and toward paper assets and the metals. Four markets sit at positioning highs within their three-year window — the 10-Year T-Note, the E-mini Nasdaq 100, Silver, and Platinum — while the Dollar Index, the E-mini Dow, and Cotton #2 press to positioning lows; the T-Note and Nasdaq 100 on the high side and the Dollar Index on the low side each set fresh window records. Six of the seven markets tracked here are new entries this week, which is itself a fact worth noting — the tape does not often reprice this many books at once, and when the records cluster on opposite ends of the same ledger, the patient man watches to see which side yields first.
Market
Side
Percentile
New
10-Year U.S. T-Note
▲ HIGH
100th
E-mini Nasdaq 100
▲ HIGH
100th
New
US Dollar Index
▼ LOW
1st
New
E-mini Dow ($5)
▼ LOW
1st
New
Cotton #2
▼ LOW
2nd
New
Silver
▲ HIGH
97th
New
Platinum
▲ HIGH
96th
New
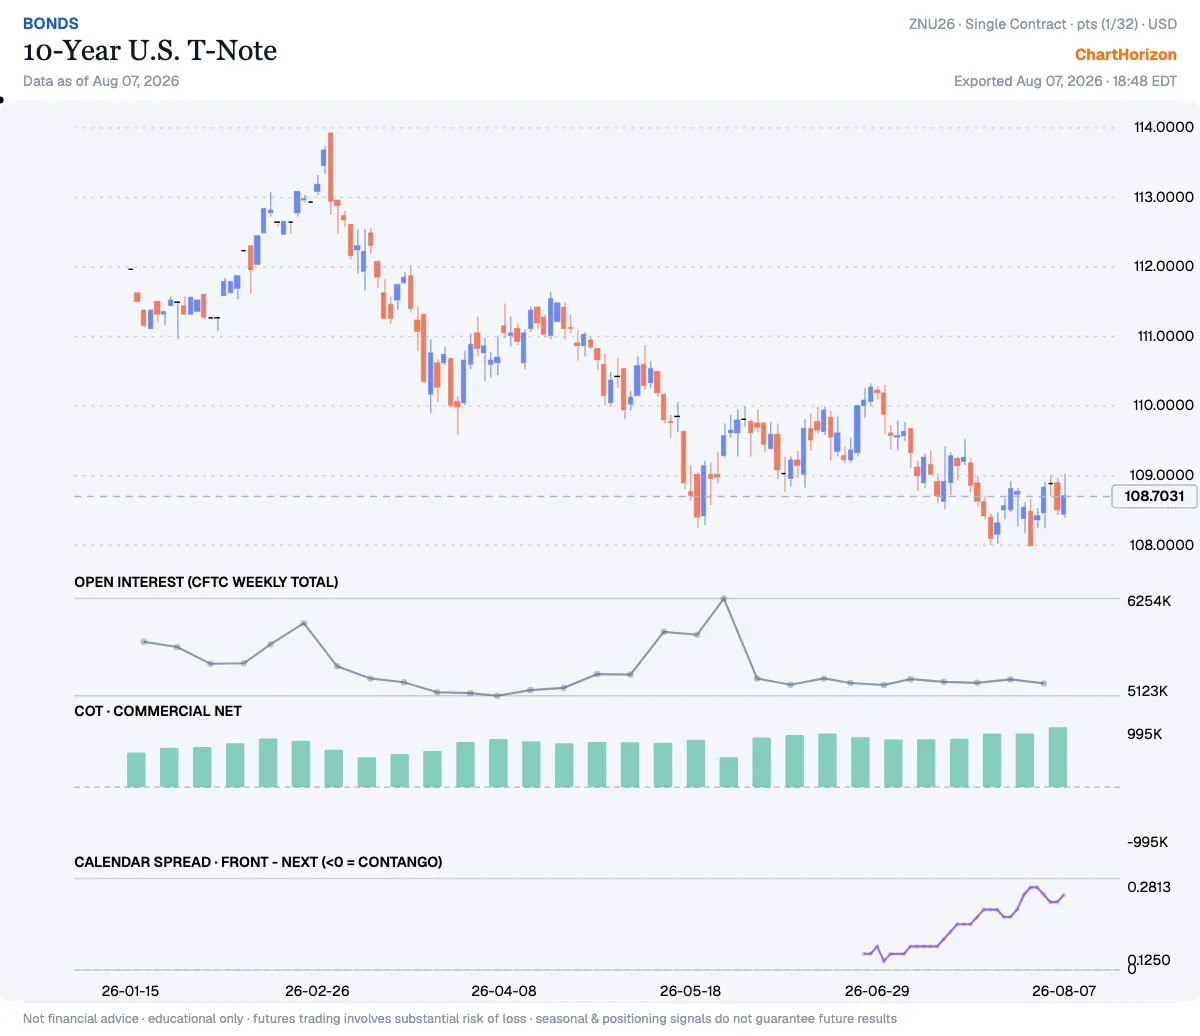
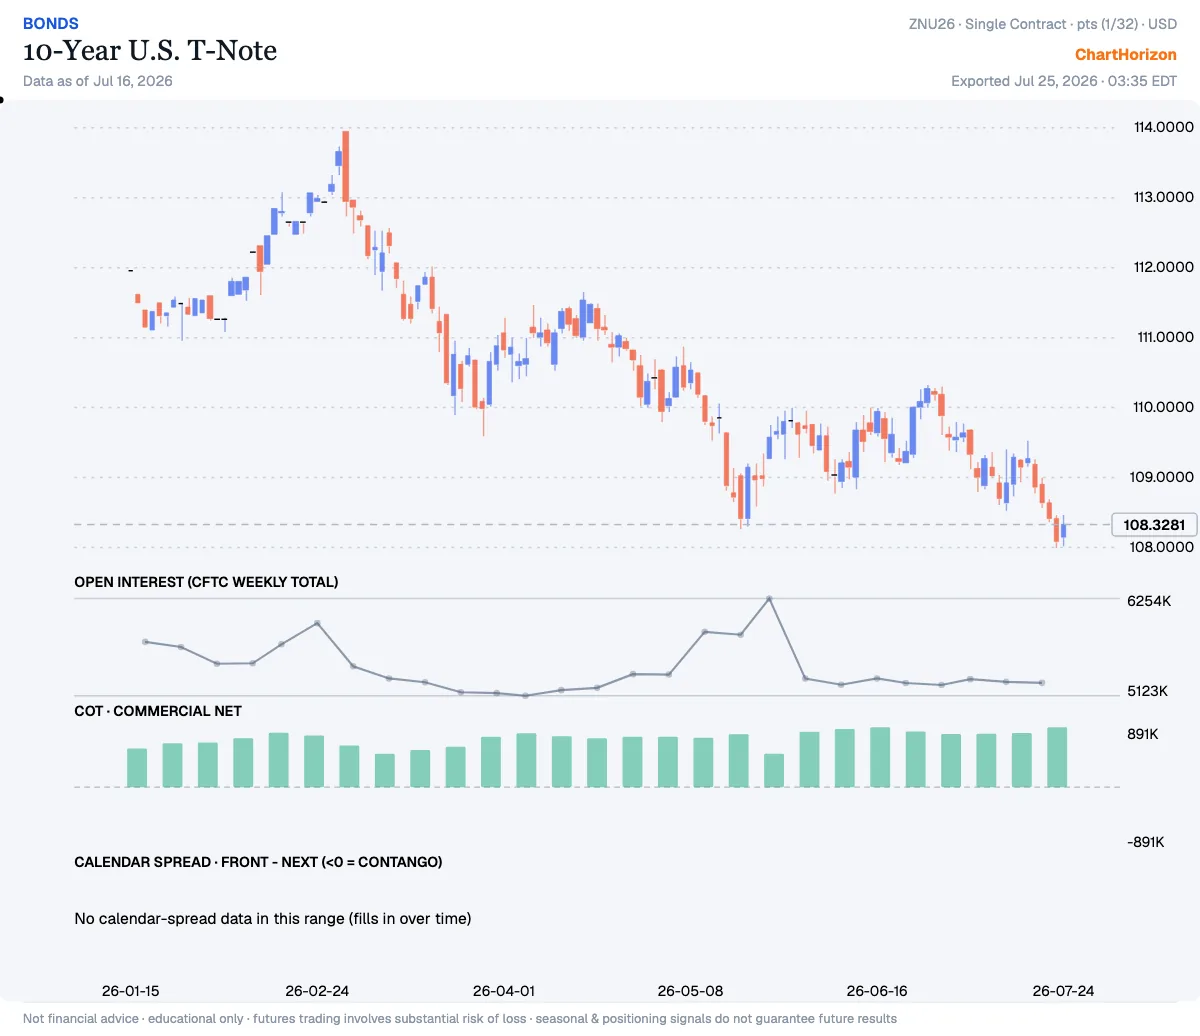
10-Year U.S. T-Note — commercials at a 3-year HIGH (fresh record)
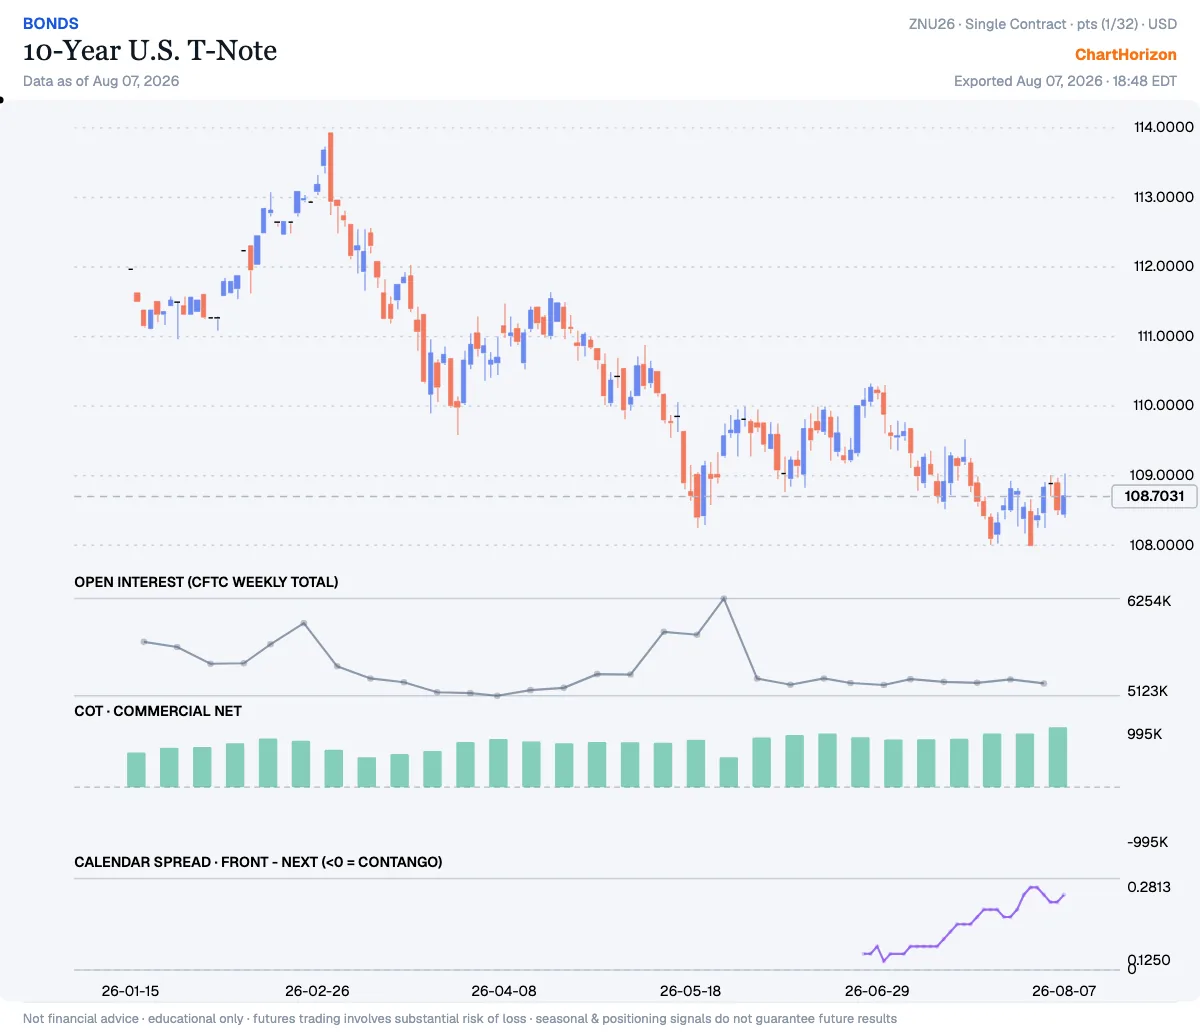
Commercial Net sits at the 100th percentile of its ~3-year range — the commercials (hedgers, the “smart-money” side) have been heavy net buyers. That is a fresh record for the window. Net: +995,416 contracts (as of 2026-08-04).
E-mini Nasdaq 100 — commercials at a 3-year HIGH (fresh record)
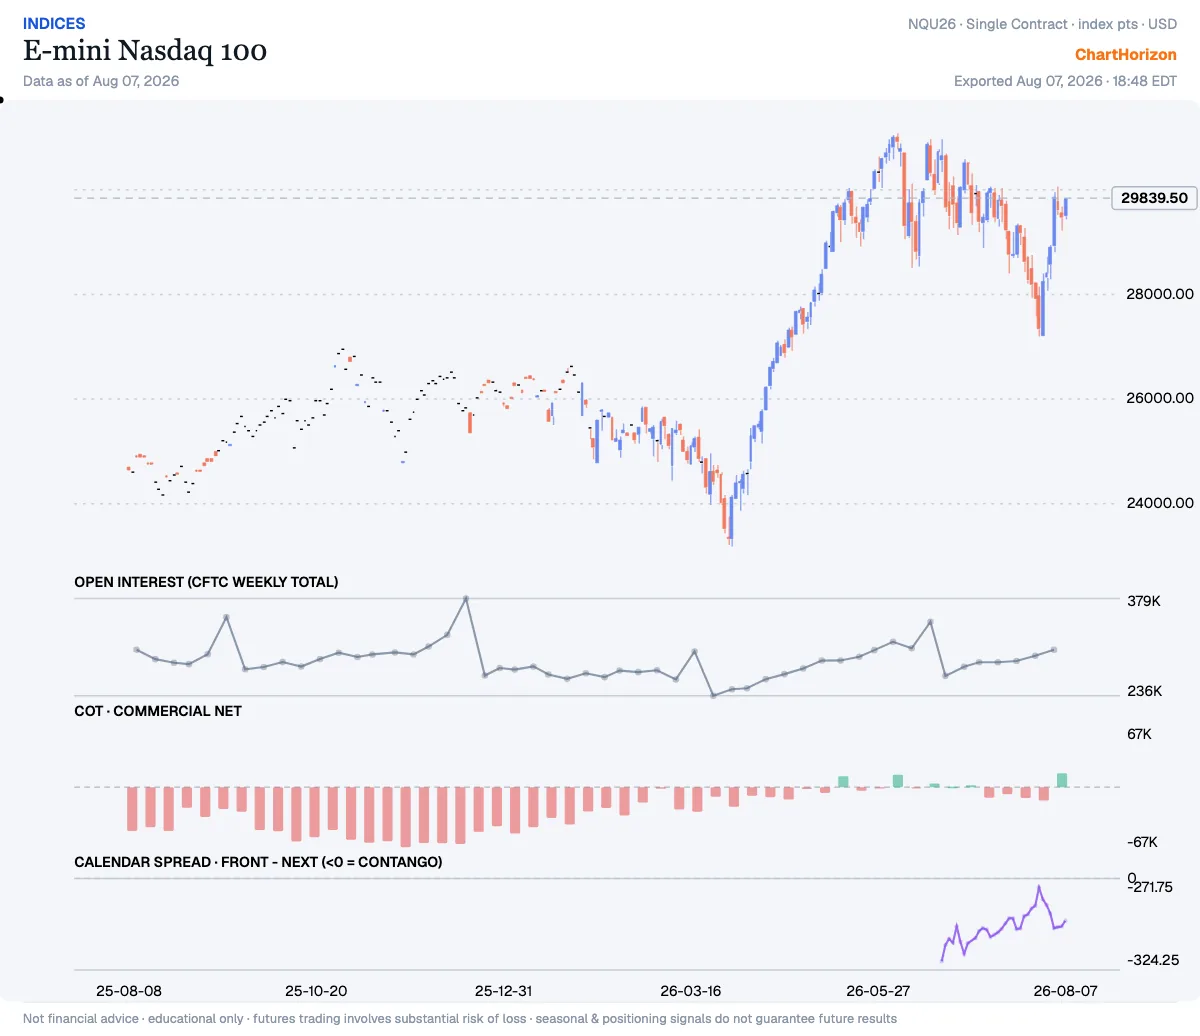
Commercial Net sits at the 100th percentile of its ~3-year range — the commercials (hedgers, the “smart-money” side) have been heavy net buyers. That is a fresh record for the window. Net: +15,442 contracts (as of 2026-08-04). New this week.
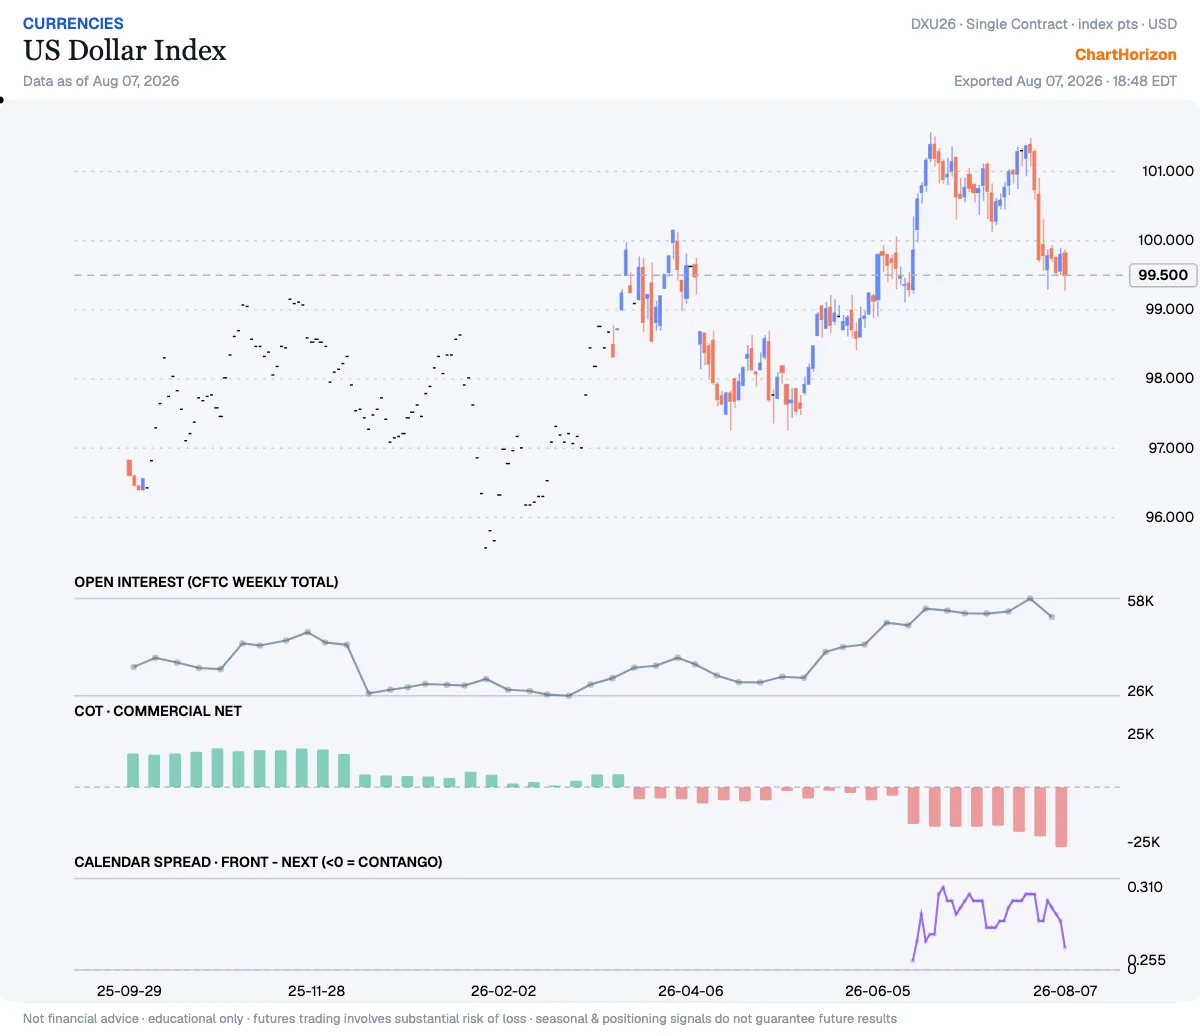
US Dollar Index — commercials at a 3-year LOW (fresh record)
Commercial Net sits at the 1st percentile of its ~3-year range — the commercials (hedgers, the “smart-money” side) have been heavy net sellers. That is a fresh record for the window. Net: -24,626 contracts (as of 2026-08-04). New this week.
E-mini Dow ($5) — commercials at a 3-year LOW
Commercial Net sits at the 1st percentile of its ~3-year range — the commercials (hedgers, the “smart-money” side) have been heavy net sellers. Net: -25,579 contracts (as of 2026-08-04). New this week.
Cotton #2 — commercials at a 3-year LOW
Producer/Merchant Net sits at the 2nd percentile of its ~3-year range — the commercials (hedgers, the “smart-money” side) have been heavy net sellers. Net: -140,793 contracts (as of 2026-08-04). New this week.
Silver — commercials at a 3-year HIGH
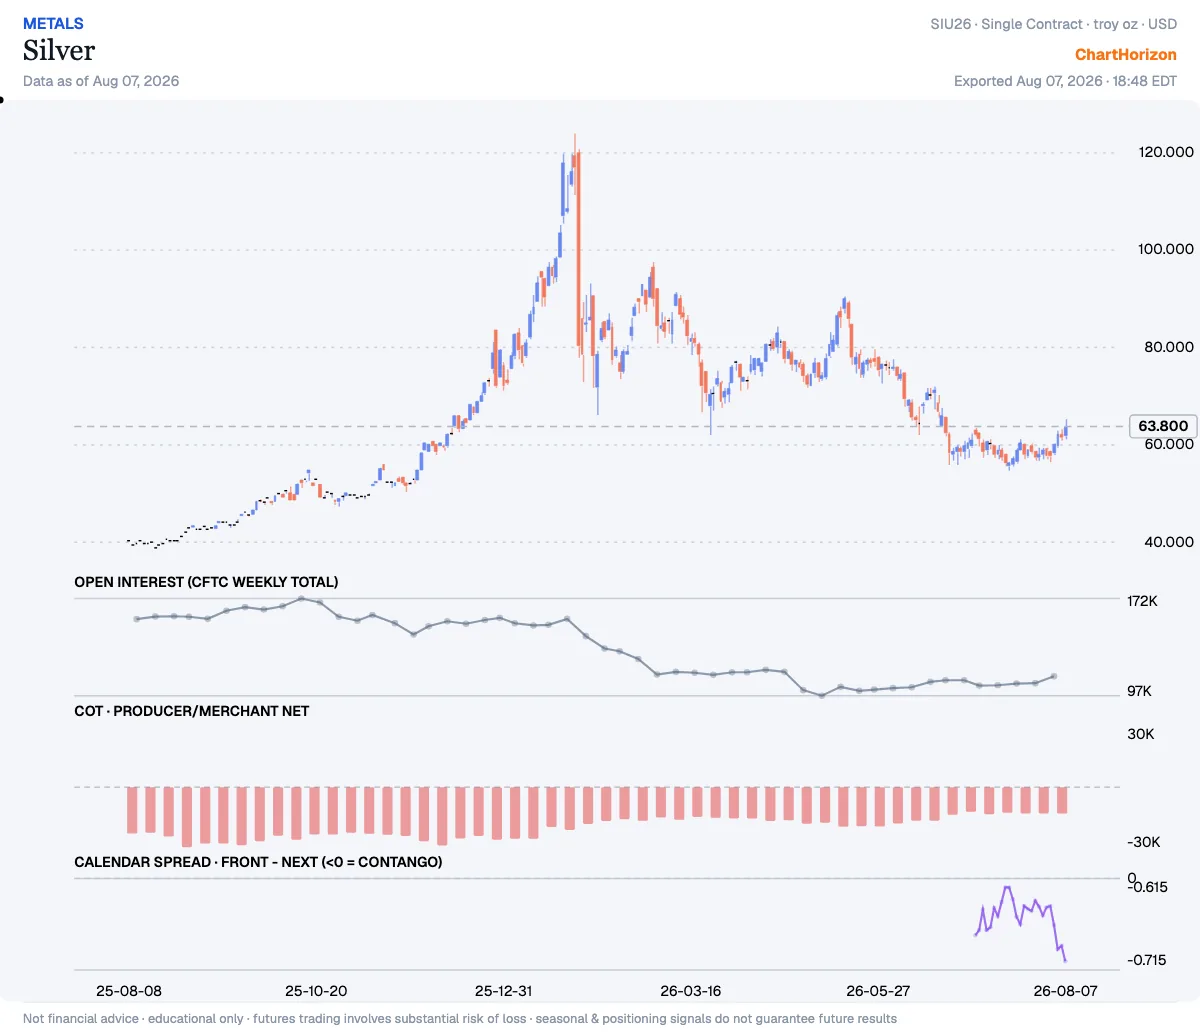
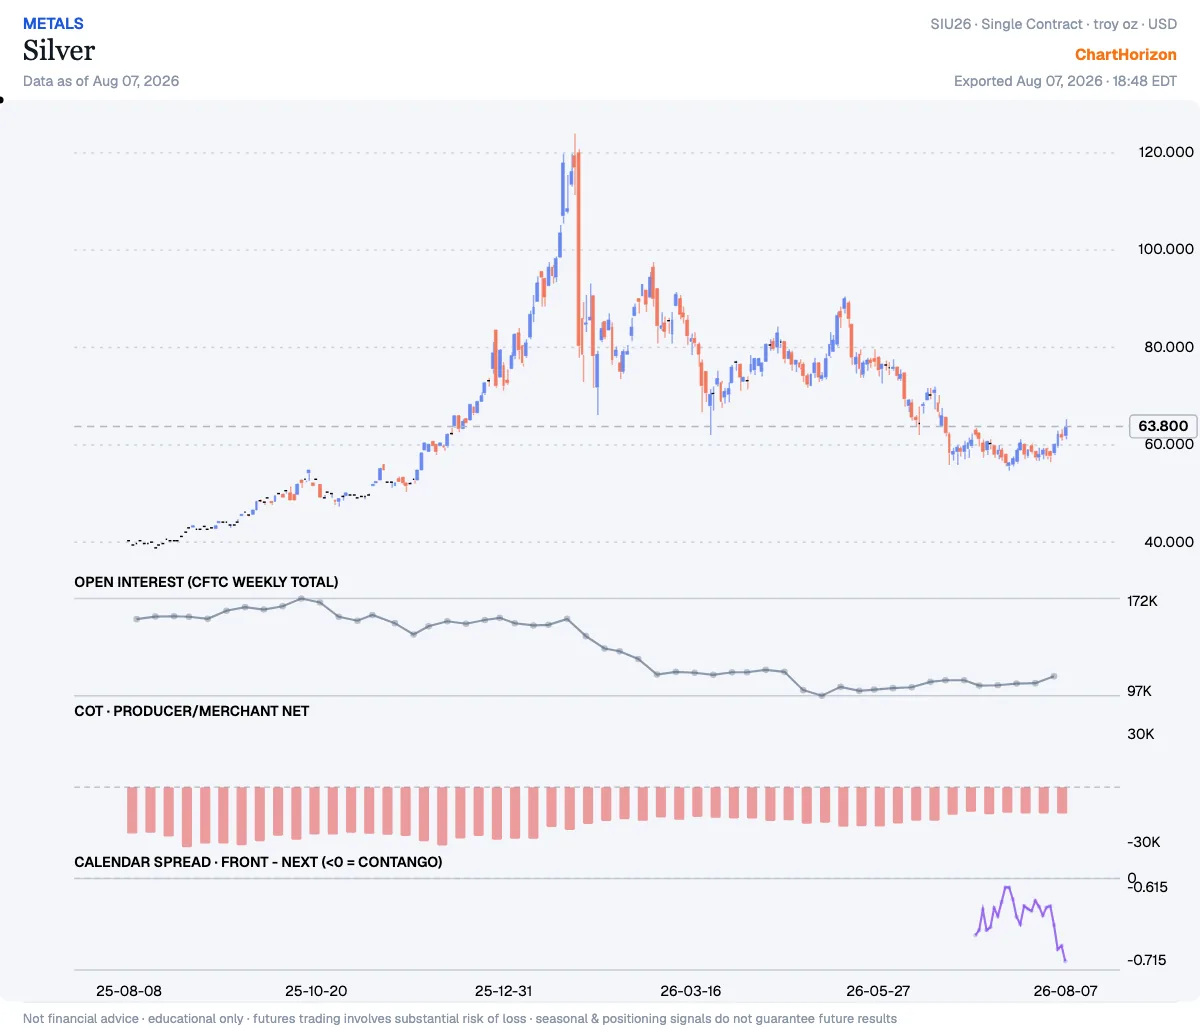
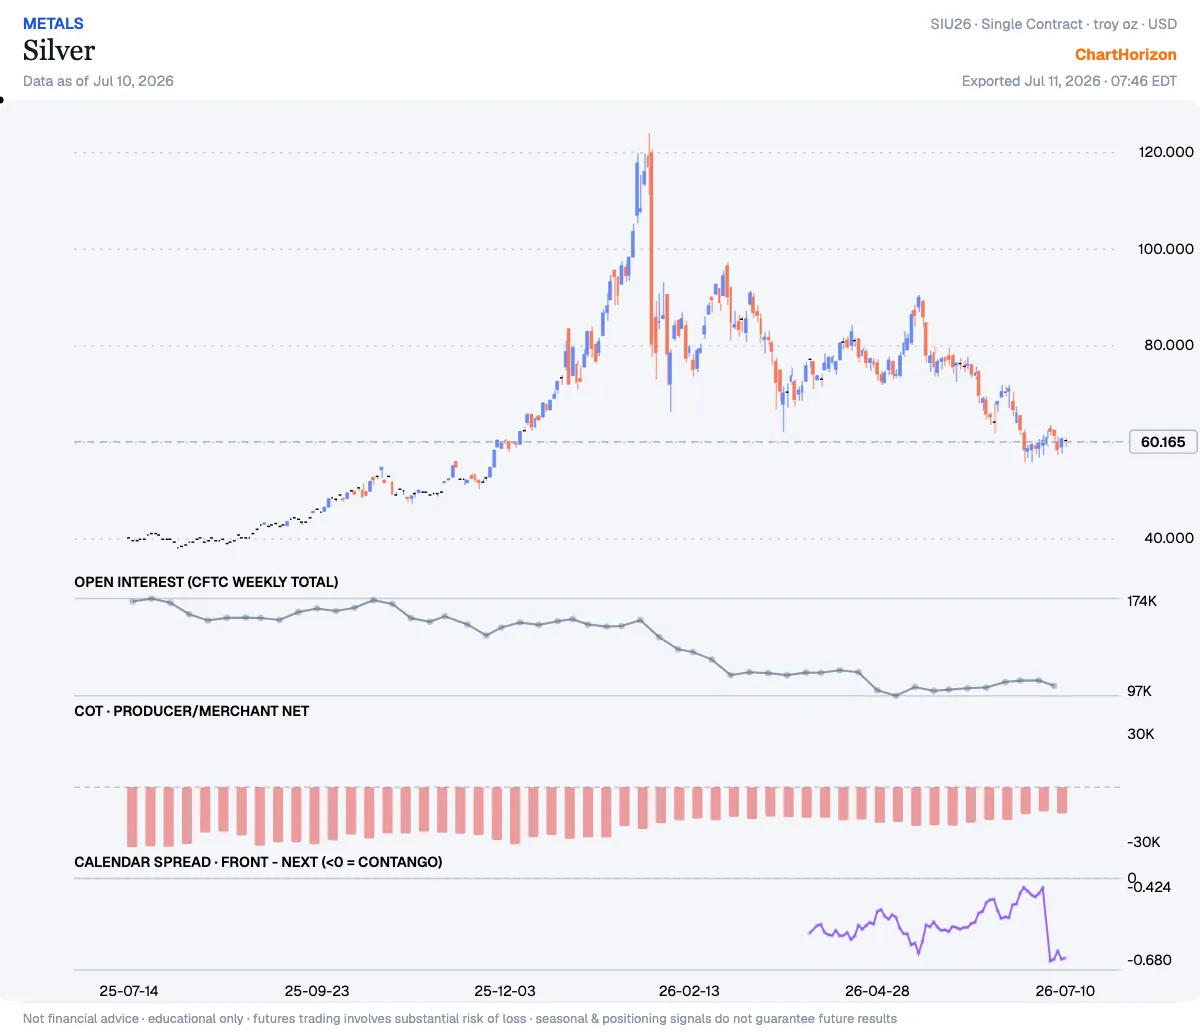
Producer/Merchant Net sits at the 97th percentile of its ~3-year range — the commercials (hedgers, the “smart-money” side) remain net short here, as producers structurally are, but less short than at almost any point in three years. The move is short-covering, not accumulation. Net: -13,080 contracts (as of 2026-08-04). New this week.
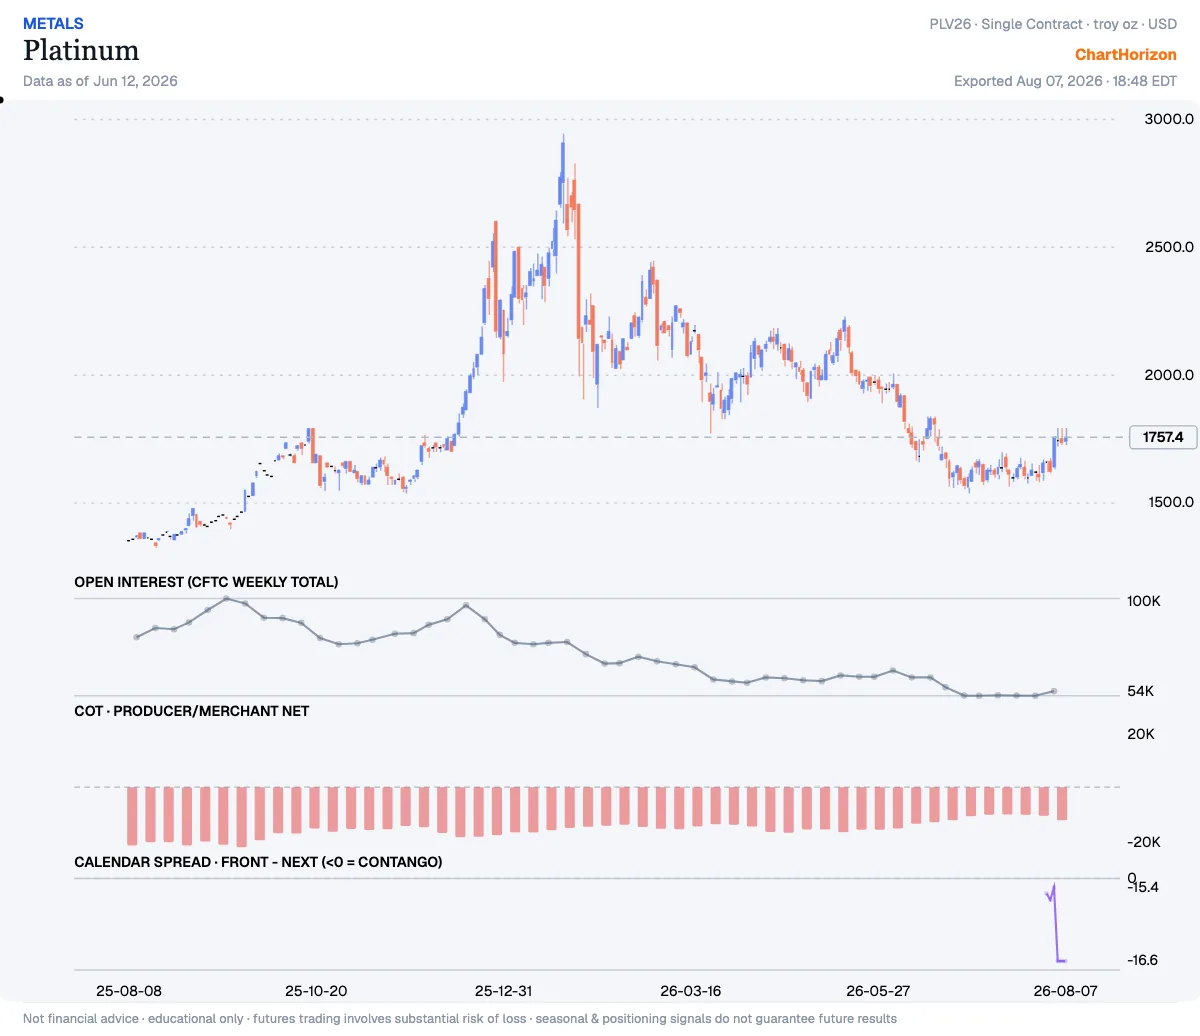
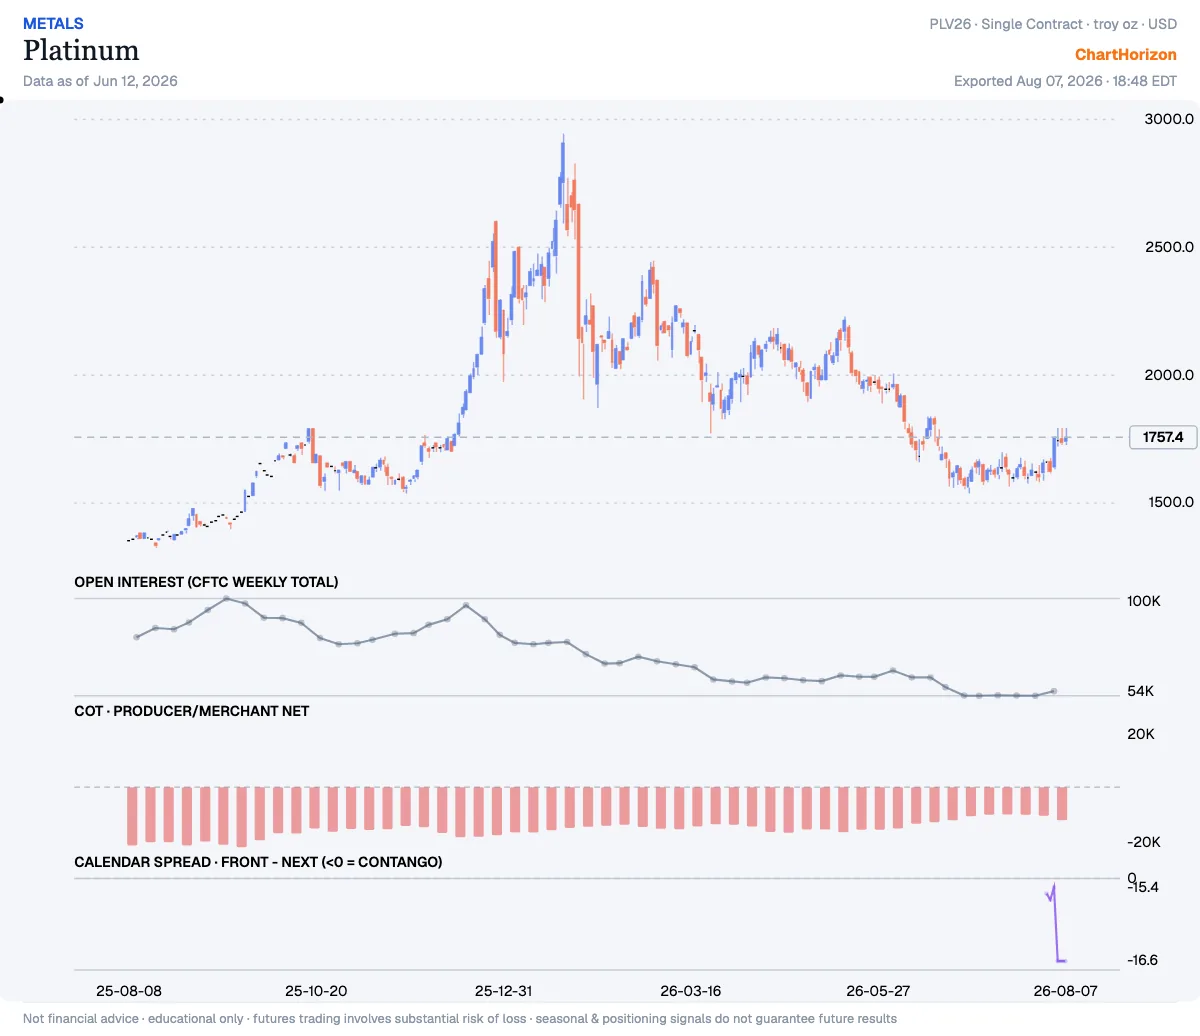
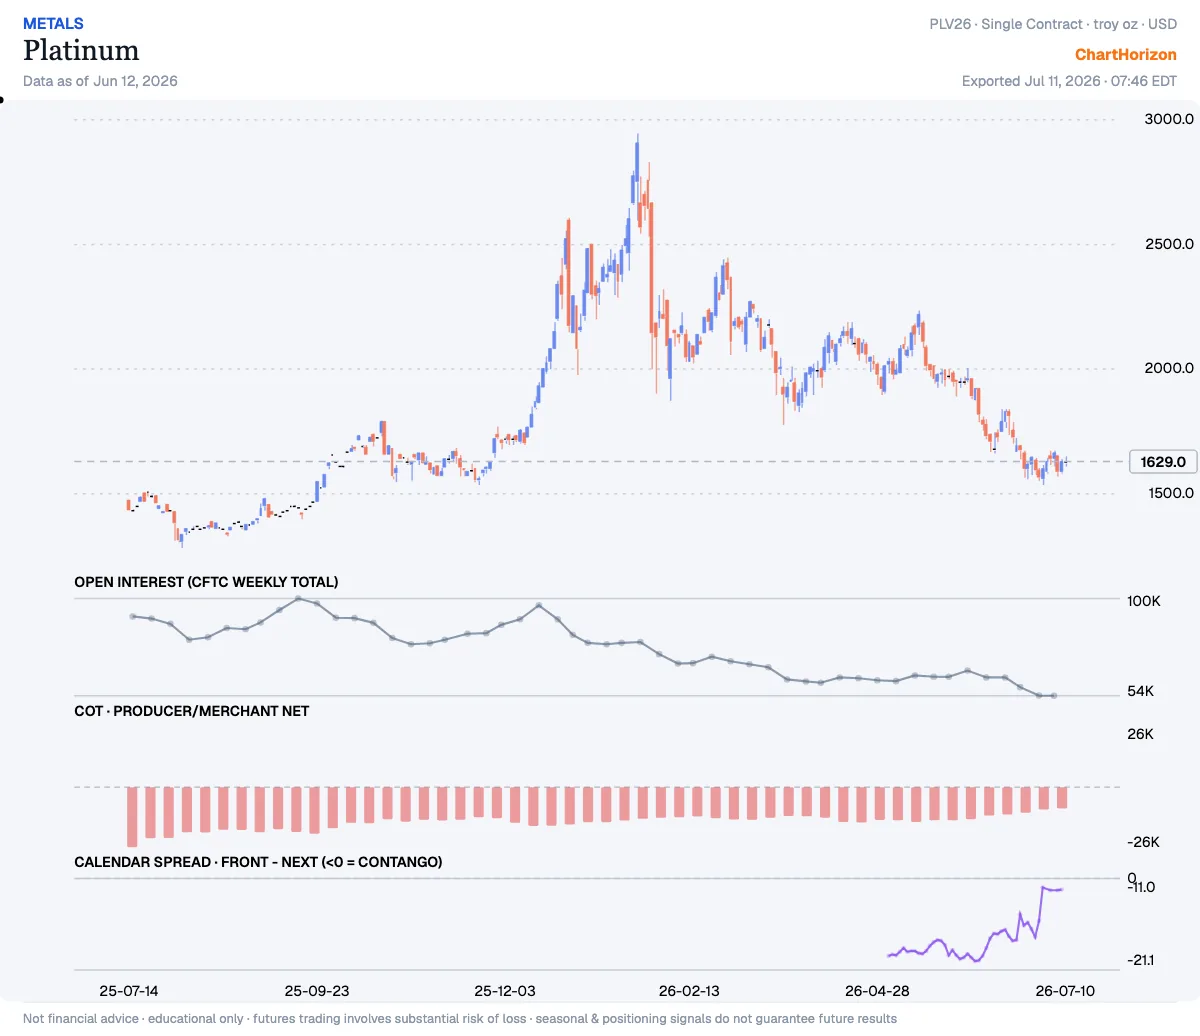
Platinum — commercials at a 3-year HIGH
Producer/Merchant Net sits at the 96th percentile of its ~3-year range — the commercials (hedgers, the “smart-money” side) remain net short here, as producers structurally are, but less short than at almost any point in three years. The move is short-covering, not accumulation. Net: -11,155 contracts (as of 2026-08-04). New this week.
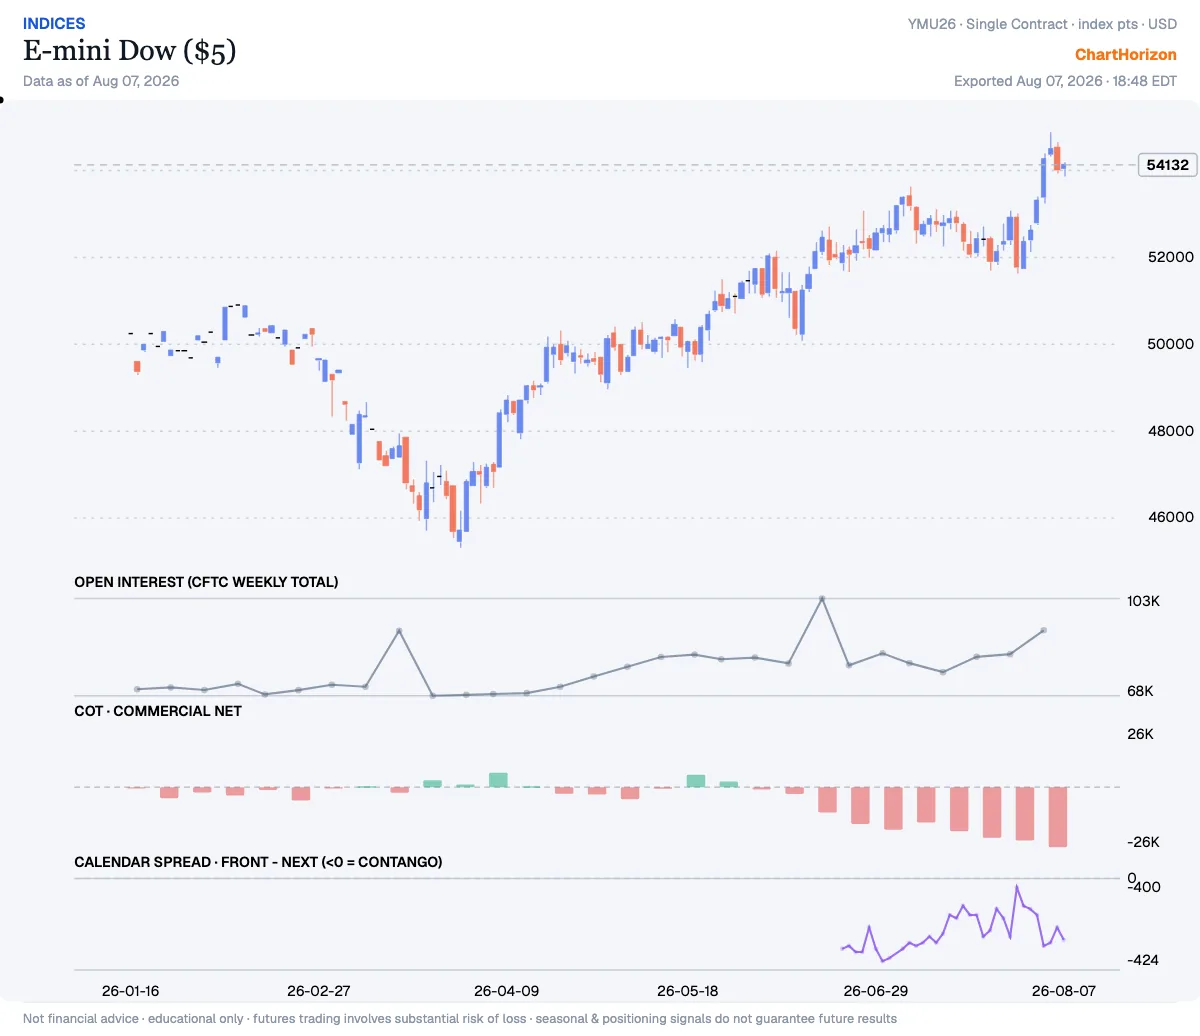
]]>ChartHorizonThe Warning Was Filed on Tuesday2026-08-08T00:00:00+02:002026-08-08T00:00:00+02:00https://chart-horizon.com/2026/08/08/warning-filed-on-tuesdayOn Monday the Dow Jones Industrial Average closed at 53,178.41, up 693 points, an all-time high.
On Tuesday the commercial hedgers in that contract were carrying their largest net short position
in three years. On Friday the Bureau of Labor Statistics reported that American payrolls had
fallen by 23,000 in July, against a consensus looking for a gain of eighty thousand.
Note the order of those three sentences. It is the only thing about this week worth thinking hard
about.
The Commitments of Traders report published on Friday carries a snapshot dated Tuesday, 4 August.
Whatever the hedgers knew or guessed, they had arranged their books before the payroll number
existed — one day after the equity market printed its record, three days before the labour market
printed its contraction. This is what makes the report worth reading at all. It is not a forecast.
It is a record of what the people who must be in these markets were willing to pay to be protected
from, at a moment when the tape was giving them every excuse not to bother.
Four entries in one hand
10-Year U.S. T-Note · commercial net positioning · ChartHorizon
Commercial Net in the 10-Year T-Note stands at +995,416 contracts — the 100th percentile of its
three-year range, and a fresh record for that window. In the Dollar Index the same cohort is net
short 24,626 contracts, the 1st percentile, also a record. In the E-mini Dow they are short 25,579,
the 1st percentile. And in Silver the producer book, which is structurally short because producers
sell what they dig, has covered back to the least-short reading in three years.
US Dollar Index · commercial net positioning · ChartHorizon
Read those four as one sentence and they say something quite specific: lower yields, a weaker
dollar, equity downside worth paying for, and metal worth owning rather than hedging. That is not
a diversified book. That is one opinion, expressed four times, by people who are not paid to have
opinions.
E-mini Dow ($5) · commercial net positioning · ChartHorizonSilver · producer/merchant net positioning · ChartHorizon
Silver deserves its own line, because the wording matters. The producer book is still net short
13,080 contracts. It has not turned long and it is not about to; a miner with metal in the ground
sells it forward as a matter of arithmetic, not conviction. What has happened is that the miners
have bought back more of that hedge than at any time in three years — while the metal ran better
than nine per cent in a week to the neighbourhood of sixty-three dollars. Producers who lift hedges
into strength are not calling a top. They are declining to sell the future cheaply, and that is a
different animal.
What the week actually delivered
The hedgers filed on Tuesday. Here is what arrived afterwards.
Friday’s employment report was bad in the way that matters and ambiguous in the way that always
follows. Payrolls fell 23,000. June was revised down to a gain of 20,000, and May and June together
were marked down by 103,000 — a third of a year of job growth erased by revision. The unemployment
rate fell, to 4.1 per cent, but it fell because people left the labour force rather than because
they found work. And the headline was flattered in the other direction too: government payrolls
dropped 53,000 on seasonal quirks that may be revised away, while private payrolls actually rose
30,000. It was a weak number with an argument inside it.
That argument runs directly into the Federal Reserve. On 29 July the Committee held the funds rate
at 3.50–3.75 per cent for the fifth consecutive meeting — but the vote was 9–3, and all three
dissenters wanted to raise. Beth Hammack, Neel Kashkari and Lorie Logan each preferred a quarter
point higher. Three dissents pointing the same way had not happened since September 2016. The
Committee’s own year-end projections had drifted up to a 3.6–4.1 per cent range, from 3.25–3.75 per
cent previously. This is a Fed being pulled toward tightening by inflation while the labour market
quietly contracts underneath it — and it is Kevin Warsh’s Fed now, sworn in on 22 May after the
most divided confirmation vote in the institution’s history, and not a man the market reads as
eager to cut.
So the commercial book is positioned for the labour market to win that argument. The Committee’s
published projections say the other side wins. Both cannot be right, and only one of them is
risking money on it.
Where the signal argues with itself
An honest ledger includes the entries that spoil the story, and there are two.
E-mini Nasdaq 100 · commercial net positioning · ChartHorizon
The first is the Nasdaq. In the same report, in the same week, commercials are at a record net
long +15,442 contracts in the E-mini Nasdaq 100 — the 100th percentile, the opposite corner of
the board from their Dow book. Whatever is being hedged here, it is not “equities” as a bloc. It is
the industrial, cyclical, dividend-paying index being sold against a technology index being bought.
That is a rotation trade wearing the clothes of a warning, and anyone who tells you the hedgers are
short the stock market this week has not read the whole page.
The second is the dollar itself. The commercial book is at a record short — and the Dollar Index
spent Friday rising, three tenths of a per cent, to a hair under 100. The 10-Year yield sat at
4.68 per cent, not far off eighteen-month highs. The market has not yet agreed with the hedge. That
is precisely what makes it a warning rather than a confirmation: a warning is what you call a
position the tape has not paid off yet.
The rest of the board
Two further entries round out the report.
Cotton #2 · producer/merchant net positioning · ChartHorizon
Cotton’s producer book sits at the 2nd percentile, net short 140,793 contracts — growers hedged
hard into their own crop, an agricultural story with its own weather and its own arithmetic, not a
macro signal.
Platinum · producer/merchant net positioning · ChartHorizon
Platinum, like silver, has covered back to the least-short end of its three-year range at the 96th
percentile. The metals lean the same way; the fibre leans hard the other.
Seven markets, four of them at fresh three-year extremes, and six of the seven new to that register
this week. The tape does not reprice that many books at once very often, and when it does the
sensible response is not to trade the headline but to write down what would prove it wrong.
Here is that note. If the labour market was the tell, the T-Note book gets paid, the dollar breaks
under its recent range, and the miners’ reluctance to sell forward looks like foresight. If the
three dissenters were the tell, then a record long in the Treasury complex meets a Fed that raises
into a soft patch, and the most crowded hedge on the board becomes the most expensive one. The Dow
short is the entry that resolves first either way, because it is the one facing a market at a record
high with nothing but positioning against it.
The hedgers filed their view on Tuesday. The number that tests it arrived on Friday. What has not
yet happened is the part where the price agrees — and until it does, this is a warning and not a
verdict. There is no prize for guessing which, and no penalty whatever for reading the next report
before deciding.
]]>ChartHorizonWhere the Metal Went2026-08-04T00:00:00+02:002026-08-04T00:00:00+02:00https://chart-horizon.com/2026/08/04/where-the-metal-wentThere is a number the gold internet has been reciting for eighteen months, and it is true. In early
April of 2025 the COMEX warehouses held 45.1 million ounces of gold. Today the combined
registered-and-eligible pile is somewhere in the middle twenties of millions of ounces, depending
whose daily count you take, and the registered portion — the metal that actually carries a warrant
and can actually be delivered against a futures contract — stood at 14.51 million ounces on 31
July, down 3.8 per cent in thirty days.
That is a genuine drain, and it has been going on long enough that nobody can call it noise.
The explanation attached to it is where the trouble starts. The explanation is that Asia is buying
the metal away — that Shanghai bids a premium, that the arbitrage pulls bullion out of New York
and onto a plane, and that the West is being quietly stripped of the physical while it plays with
the paper. It is a satisfying story. It has a villain, a mechanism, and an implied trade.
It also has a problem. If Asia were bidding the metal away, there would be a premium. There isn’t
one.
The pile that was never supposed to be there
Start with how the gold got to New York in the first place, because the drain does not make sense
until you know what is draining.
In the winter of 2024–25 the market decided that the incoming American administration might put
tariffs on bullion. Nobody knew whether it would. That was precisely the point: an unhedgeable
binary on a metal whose entire function is to be the same everywhere. If a tariff landed on gold,
metal already inside the United States would be worth more than metal outside it, and every short
who owed an ounce in New York would need to source it domestically at whatever price the domestic
market demanded.
So the trade did what trades do with a cheap option. It moved the gold. Roughly 12.2 million ounces
were shipped into COMEX warehouses over two months; by late January 2025 something like 393 tonnes
had arrived since the election, lifting inventories by nearly three quarters to the highest level
since August 2022. The metal came overwhelmingly out of London, and London felt it. Delivery queues
at the Bank of England, normally a matter of two or three days, stretched to four and eight weeks.
For a few months the world’s deepest bullion market could not get its own gold out of its own vault
on schedule.
On 2 and 3 April 2025, the White House excluded gold from the tariff schedule. The option expired
worthless. The New York premium over London closed, and every ounce that had flown the Atlantic on
a hedge against a tariff that never came became, that afternoon, an ounce sitting in the wrong
vault, earning nothing, costing storage.
It has been going home ever since. By the end of April 2026 the LBMA counted 9,372 tonnes in
London vaults, about $1.4 trillion — recovered from the 8,477 tonnes of end-February 2025, which
had been a five-year low.
Read the COMEX drain against that and the shape changes entirely. A pile that was inflated by
seventy-five per cent in ten weeks by a regulatory scare is now deflating. Most of what is leaving
is not being torn out of the West by hungry Eastern buyers. It is a stockpile unwinding, going back
to where it lived before somebody frightened it across an ocean.
That is the unglamorous half of the answer, and it accounts for a great deal of the number everyone
is reciting.
The premium that isn’t there
Here is the test that settles it, and it takes one line.
If bullion were being pulled from New York to Shanghai by demand, the Shanghai Gold Exchange would
have to be paying up. Physical does not move across a border out of sentiment; it moves because
somebody on the far side is bidding more than somebody on the near side, by more than the cost of
the freight, the insurance, the financing and the assay.
On the morning of 30 July 2026 the Shanghai benchmark fixed about five dollars an ounce above
COMEX. Over the preceding month the gap ranged from 1.3 per cent below to 1.2 per cent above — it
spent the period oscillating around zero, a few dollars of premium one day and a few dollars of
discount the next.
Five dollars is not an arbitrage. Five dollars is noise on a four-thousand-dollar ounce. You cannot
freight, insure, finance and re-refine metal from a New York vault into a Shanghai deliverable bar
for five dollars, and no desk is trying.
So the Chinese buyer is not paying up for gold. Nor is he boycotting it — a sustained discount
would say demand had gone away, and there is no sustained discount either. He is simply paying the
world price, every day, in size, without drama. After three years in which the Shanghai premium was
one of the loudest indicators in the metal, its flatness through the middle of 2026 is its own
statement, and the statement is: nothing unusual is happening at this particular border.
Which forces the question into a better shape. If the metal is not being pulled east by price, and
the pile in New York is mostly just a tariff-scare stockpile going home — then what, if anything,
has actually shifted east?
The answer is that it was never the bullion. It was the bid.
The ounce that changed hands
The World Gold Council’s second-quarter accounts, published for the April-to-June period, contain
the real story, and it is not in the vault column. It is in the ownership column.
Total demand came in at 1,269 tonnes — flat against a year earlier. Behind that flat headline the
composition tore itself apart:
Q2 2026 demand
Change vs a year ago
Central banks & official institutions
+289 t net, up 62 %
Jewellery
−17 %
Gold-backed ETFs
−45 t (net redemptions)
Total demand
1,269 t, unchanged
Now put that beside the price. Gold made its all-time high on 29 January 2026 — 5,586.20 intraday
on this desk’s continuous contract — and closed 31 July at 4,049.10. That is a decline of better
than twenty-seven per cent in six months. The stated reasons are sound and entirely conventional:
the American conflict with Iran drove energy and inflation expectations higher, which drove
expectations of Federal Reserve tightening higher, which drove real yields higher — and a metal
that pays no coupon is worth less every time the coupon on everything else goes up. The dollar
rebounded on the same logic. Investors who had made an enormous amount of money in 2025 took some
of it off the table.
Every one of those is a price-sensitive reason to sell, and the price-sensitive holders duly
sold: the ETFs redeemed, the jewellery counters emptied, the profit was booked.
And into that decline, official institutions bought 289 tonnes — the strongest second quarter on
the record, up sixty-two per cent on the year. Not despite the twenty-seven per cent drawdown.
Through it.
The National Bank of Poland took 51 tonnes in the quarter and 82 in the half, moving toward a
self-declared target near 700 tonnes. The People’s Bank of China posted its largest reported
increase since the fourth quarter of 2023, to 2,346 tonnes. Earlier in the year, bar-and-coin
demand had run 474 tonnes in a single quarter, up forty-two per cent, with Asian retail leading it.
This is the shift, and it is worth being exact about what kind of shift it is. Nothing was seized
and nothing was cornered. What happened is that over six months a very large quantity of gold moved
from holders who owned it because the price was going up, into the hands of holders who own it for
reasons that have nothing to do with the price at all. A pension fund’s gold ETF position is a
position. A central bank’s tonnage is a policy.
Metal that moves from the first kind of hand to the second kind does not come back to market on the
next rally. It has left the float. That is a far more consequential migration than anything
happening to a warehouse receipt in New York, and it does not show up in any vault report, because
the metal need never move at all — much of it simply gets re-titled where it already sits.
The rule nobody reported
Then, on 28 June 2026, the part of this story with actual geopolitical teeth — and it arrived, as
these things usually do, as a dull consultation document.
The People’s Bank of China, jointly with the General Administration of Customs, published draft
revisions to the rules governing the import and export of gold. The stated purposes are the usual
ones: streamline administration, facilitate trade, align the framework with current conditions.
Read the specifics and something more interesting is going on.
The draft removes the provision requiring the PBoC and customs to jointly formulate the rules for
gold carried or mailed across the border by individuals — that traffic stays under customs
supervision, but the central bank steps out of the arrangement. Alongside a revision earlier in the
year, licensed entities hold permits valid for nine months, during which they may run an unlimited
number of qualifying import or export transactions, across an expanded network of approved ports.
In exchange, customs supervision is tightened at the front end: clearer scope, closer oversight of
agents, a firmer penalty regime.
Note what that is and is not. It is not liberalisation in the Western sense — the state has not let
go of anything. What it is, is a transfer of the chokepoint: away from monetary-policy discretion
at the central bank and toward routine, permanent, high-throughput customs administration. The
PBoC’s grip loosens; the plumbing widens; the flow becomes ordinary rather than exceptional.
Countries build that kind of plumbing when they intend to use it. And the reason to intend to use
it is the same reason official gold demand has run at these levels for four years running, and it
is not a market reason at all.
Since 2022 every reserve manager on earth has known something he could previously treat as
theoretical: that a sovereign’s holdings of another sovereign’s paper can be frozen by decision. A
Treasury bill is a claim on an institution that may one day be instructed not to honour it to you.
Gold in your own vault is not a claim on anybody. It pays nothing, and in return it cannot be
switched off. For most of the post-war period that trade-off was a poor one, because the yield was
real and the freeze risk was hypothetical. Both halves of that sentence have now inverted, and the
buying reflects it — Asian and Middle Eastern institutions doing the majority of the accumulating,
Western European holdings broadly static.
So the eastward shift is real. It simply is not a shift of bullion between vaults. It is a shift
in who the marginal holder is, why he holds, and whose infrastructure he uses to move it — and
the third of those is what the June draft is quietly building. A world in which the metal can be
priced in New York but cleared, stored, licensed and moved without needing New York is not built by
draining a warehouse. It is built by writing customs regulations.
What the ledger says
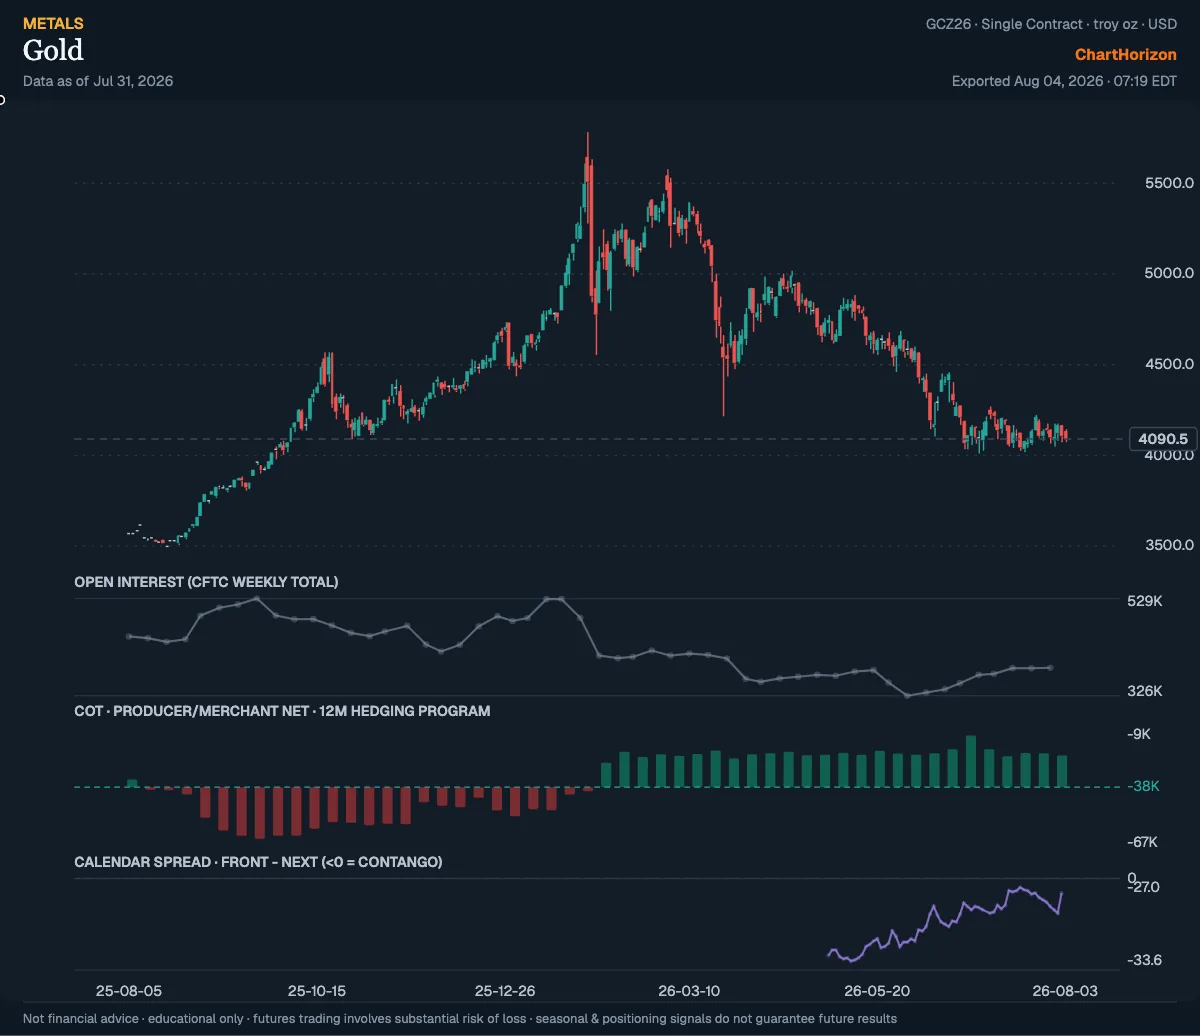
Gold · GCZ26 single contract · price, CFTC open interest, producer/merchant net vs 12-month hedging programme, front−next calendar spread · ChartHorizon
Now to the part of this that is this desk’s own arithmetic rather than anybody’s narrative, because
there is a reading in the positioning data that fits the above uncomfortably well.
The Commitments of Traders report of 28 July puts the gold producer/merchant category at 20,549
contracts net short. In isolation that means very little — producers are structurally short,
because that is what hedging a mine is. What matters is where it sits in its own history. Across
the 269 weekly reports since June 2021, 88.8 per cent show a larger short than this one. The
range on the file runs from 82,095 short at the extreme to 8,773 at the other end. The current book
sits near the light end of five years.
Sit with what that means. The gold price has fallen more than twenty-seven per cent from its high.
A producer looking at a twenty-seven per cent break in his own product, with a cost base that only
ever rises, has every textbook reason to lock in forward sales while there is still four thousand
dollars on the screen. He is not doing it. The green bars beneath the price on the card above are
that refusal, rendered against the twelve-month programme: for the whole of 2026 the industry has
hedged less than its own recent norm, into a falling market.
Producers are not oracles, and I will not dress them up as such. They are, however, the one class
of participant who knows the physical market from the supply side as a matter of daily operations,
and whose incentive to hedge is strongest exactly when they believe the price is going lower. The
refusal to hedge a twenty-seven per cent decline is the closest thing the ledger offers to a
statement of belief.
Two smaller readings sit beside it, and both point the same way.
The first is the term structure. Gold’s calendar spread — front contract minus next, negative in
contango — has narrowed steadily: −33.60 on 11 May, −27.50 on 31 July. Contango in this metal
is essentially the cost of carry: financing, storage, insurance, less what the metal earns out on
lease. Through that same stretch, rate expectations were going up, which mechanically ought to
have widened the carry. Instead the front tightened against the deferred. When contango compresses
into rising rates, the residual is the lease rate — the price of borrowing physical metal — and a
rising lease rate is what tightness at the front of the curve looks like before it looks like
anything else.
The second is open interest, and its timing is the tell. It peaked at 528,789 contracts on 23
September 2025 — four months before the price high of 29 January. The last leg of the greatest
gold rally in a generation was made on a shrinking book: fewer and fewer contracts carrying the
price higher, which is distribution wearing a bull market’s clothes. It then collapsed with the
decline to 326,052 in the first week of June. It has since rebuilt to 384,603. Open interest that
rises off a low while price grinds sideways above 4,000 is new money taking positions, not old
money capitulating.
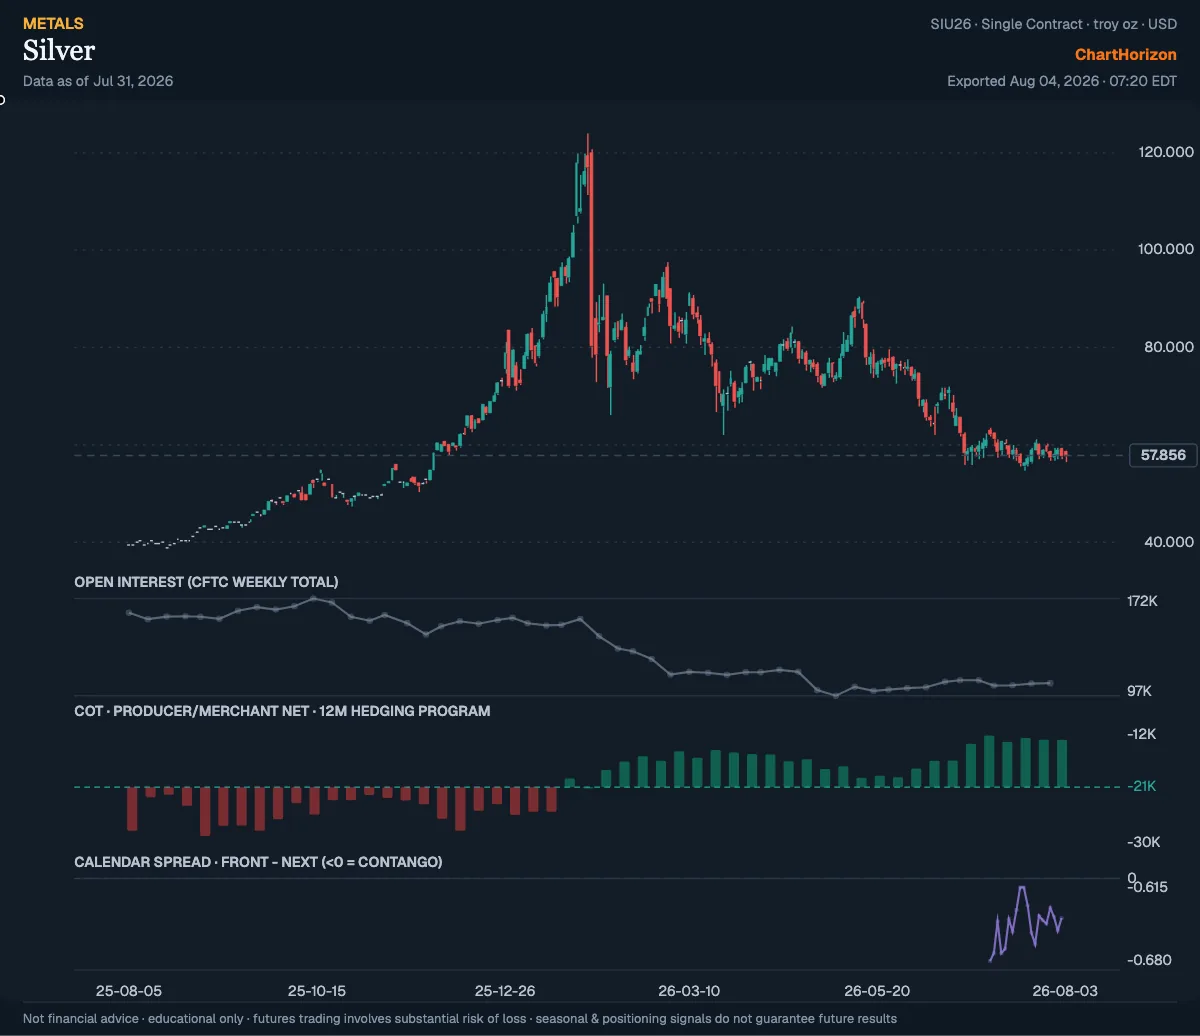
Silver · SIU26 single contract · same panes · ChartHorizon
And if gold’s hedging book is quiet, silver’s is nearly silent. Silver made 121.30 on the same day
gold made its high, and closed 31 July at 57.59 — it has more than halved in six months. The producer/merchant book stands at 13,029 net short, and 99.3 per cent of every report
on the five-year file shows a bigger short than that. A halving of the price, and the people who
dig it out of the ground have all but stopped selling it forward.
I do not know what the miners know. I know what they are declining to do, and they are declining to
do it in two metals at once, at the same percentile, after the worst six months either has had in a
decade.
The read
The vault story, as it is usually told, is wrong in its mechanism and roughly right in its
direction, which is the most dangerous combination a market narrative can have — because it will
appear to be confirmed by events it did not predict.
What is actually established, and what is not:
Established. The COMEX pile is genuinely smaller, and most of the shrinkage is a 2025
tariff-scare stockpile going home to London, which the LBMA’s own recovery to 9,372 tonnes
corroborates. Asia is not bidding the metal away — the Shanghai premium has spent a month within a
per cent of zero in both directions. Official institutions bought 289 tonnes in the second quarter,
up sixty-two per cent, into a twenty-seven per cent drawdown, while ETFs redeemed and jewellery
fell seventeen per cent. China has drafted a framework that moves cross-border gold from
central-bank discretion to routine customs throughput. Producers in both metals are carrying among
the lightest hedge books of the past five years.
Not established. That any of this makes gold go up next month. It does not. A metal can be
structurally accumulated by patient sovereign hands and still fall for another two quarters on real
yields, because the marginal price is set by the impatient. That is exactly what the past six
months were. Monday’s session made the point: the tape opened at 4,135.20 on news that Washington
had paused planned strikes on Iran after allies pressed for de-escalation — up 0.7 per cent — and
then spent the day giving it back. Gold’s news is not currently gold’s price.
So the watch-list, which is the honest holding here rather than a position.
Watch the Shanghai premium, and watch it for a sustained break above one per cent — not a day,
a fortnight. That is the number that would convert the eastward story from a change in ownership
into an actual movement of bullion, and it is presently telling you it has not happened.
Watch the registered stock rather than the total. Eligible metal going home to London is
housekeeping. Registered stock falling while delivery volumes stay elevated is a shrinking
deliverable float against live obligations, and that is the version of the drain that has teeth.
Watch the calendar spread, because it is the cheapest tightness gauge available and it has been
narrowing for three months into rising rates. Let it keep closing toward zero and the lease market
is telling you something the warehouse report is too slow to say.
Watch the hedging book above all. Producers who will not sell a twenty-seven per cent decline
forward have made a judgement. If they start selling into the next rally, they have changed their
minds and you should change yours. If they hold this light through another leg down, that is a
supply side that has stopped believing in the price on the screen.
And watch the Chinese draft become a rule. Consultation documents are not policy. But a state that
widens its bullion plumbing at the exact moment its central bank is posting its largest reserve
addition in three years is not doing two unrelated things.
The metal did not run east. It was bought east — slowly, at ordinary prices, by buyers who do not
care what the ounce does next quarter, from sellers who cared a great deal. The vault reports
record the freight. They do not record the transfer, and the transfer is the whole of it.
]]>ChartHorizonThe Weekly Tape — the yen did not turn, it was turned2026-08-01T00:00:00+02:002026-08-01T00:00:00+02:00https://chart-horizon.com/2026/08/01/yen-warning-shotThere is no market so friendless as the one everybody uses and nobody wants. For a year the yen
has been exactly that — not an investment but a utility. The world’s cheapest money, borrowed in
order to be sold, the loose change funding every crowded long from Sydney to Chicago. A currency
in that office does not decline because the country behind it is failing. It declines because it
is useful declining, and because the whole street has learned it can be leaned upon without
consequence.
Last week the leaning stopped — but not because the market changed its mind. It stopped because
two governments put their hands on the scale, and one of them had not touched this market in
fifteen years.
The two nights
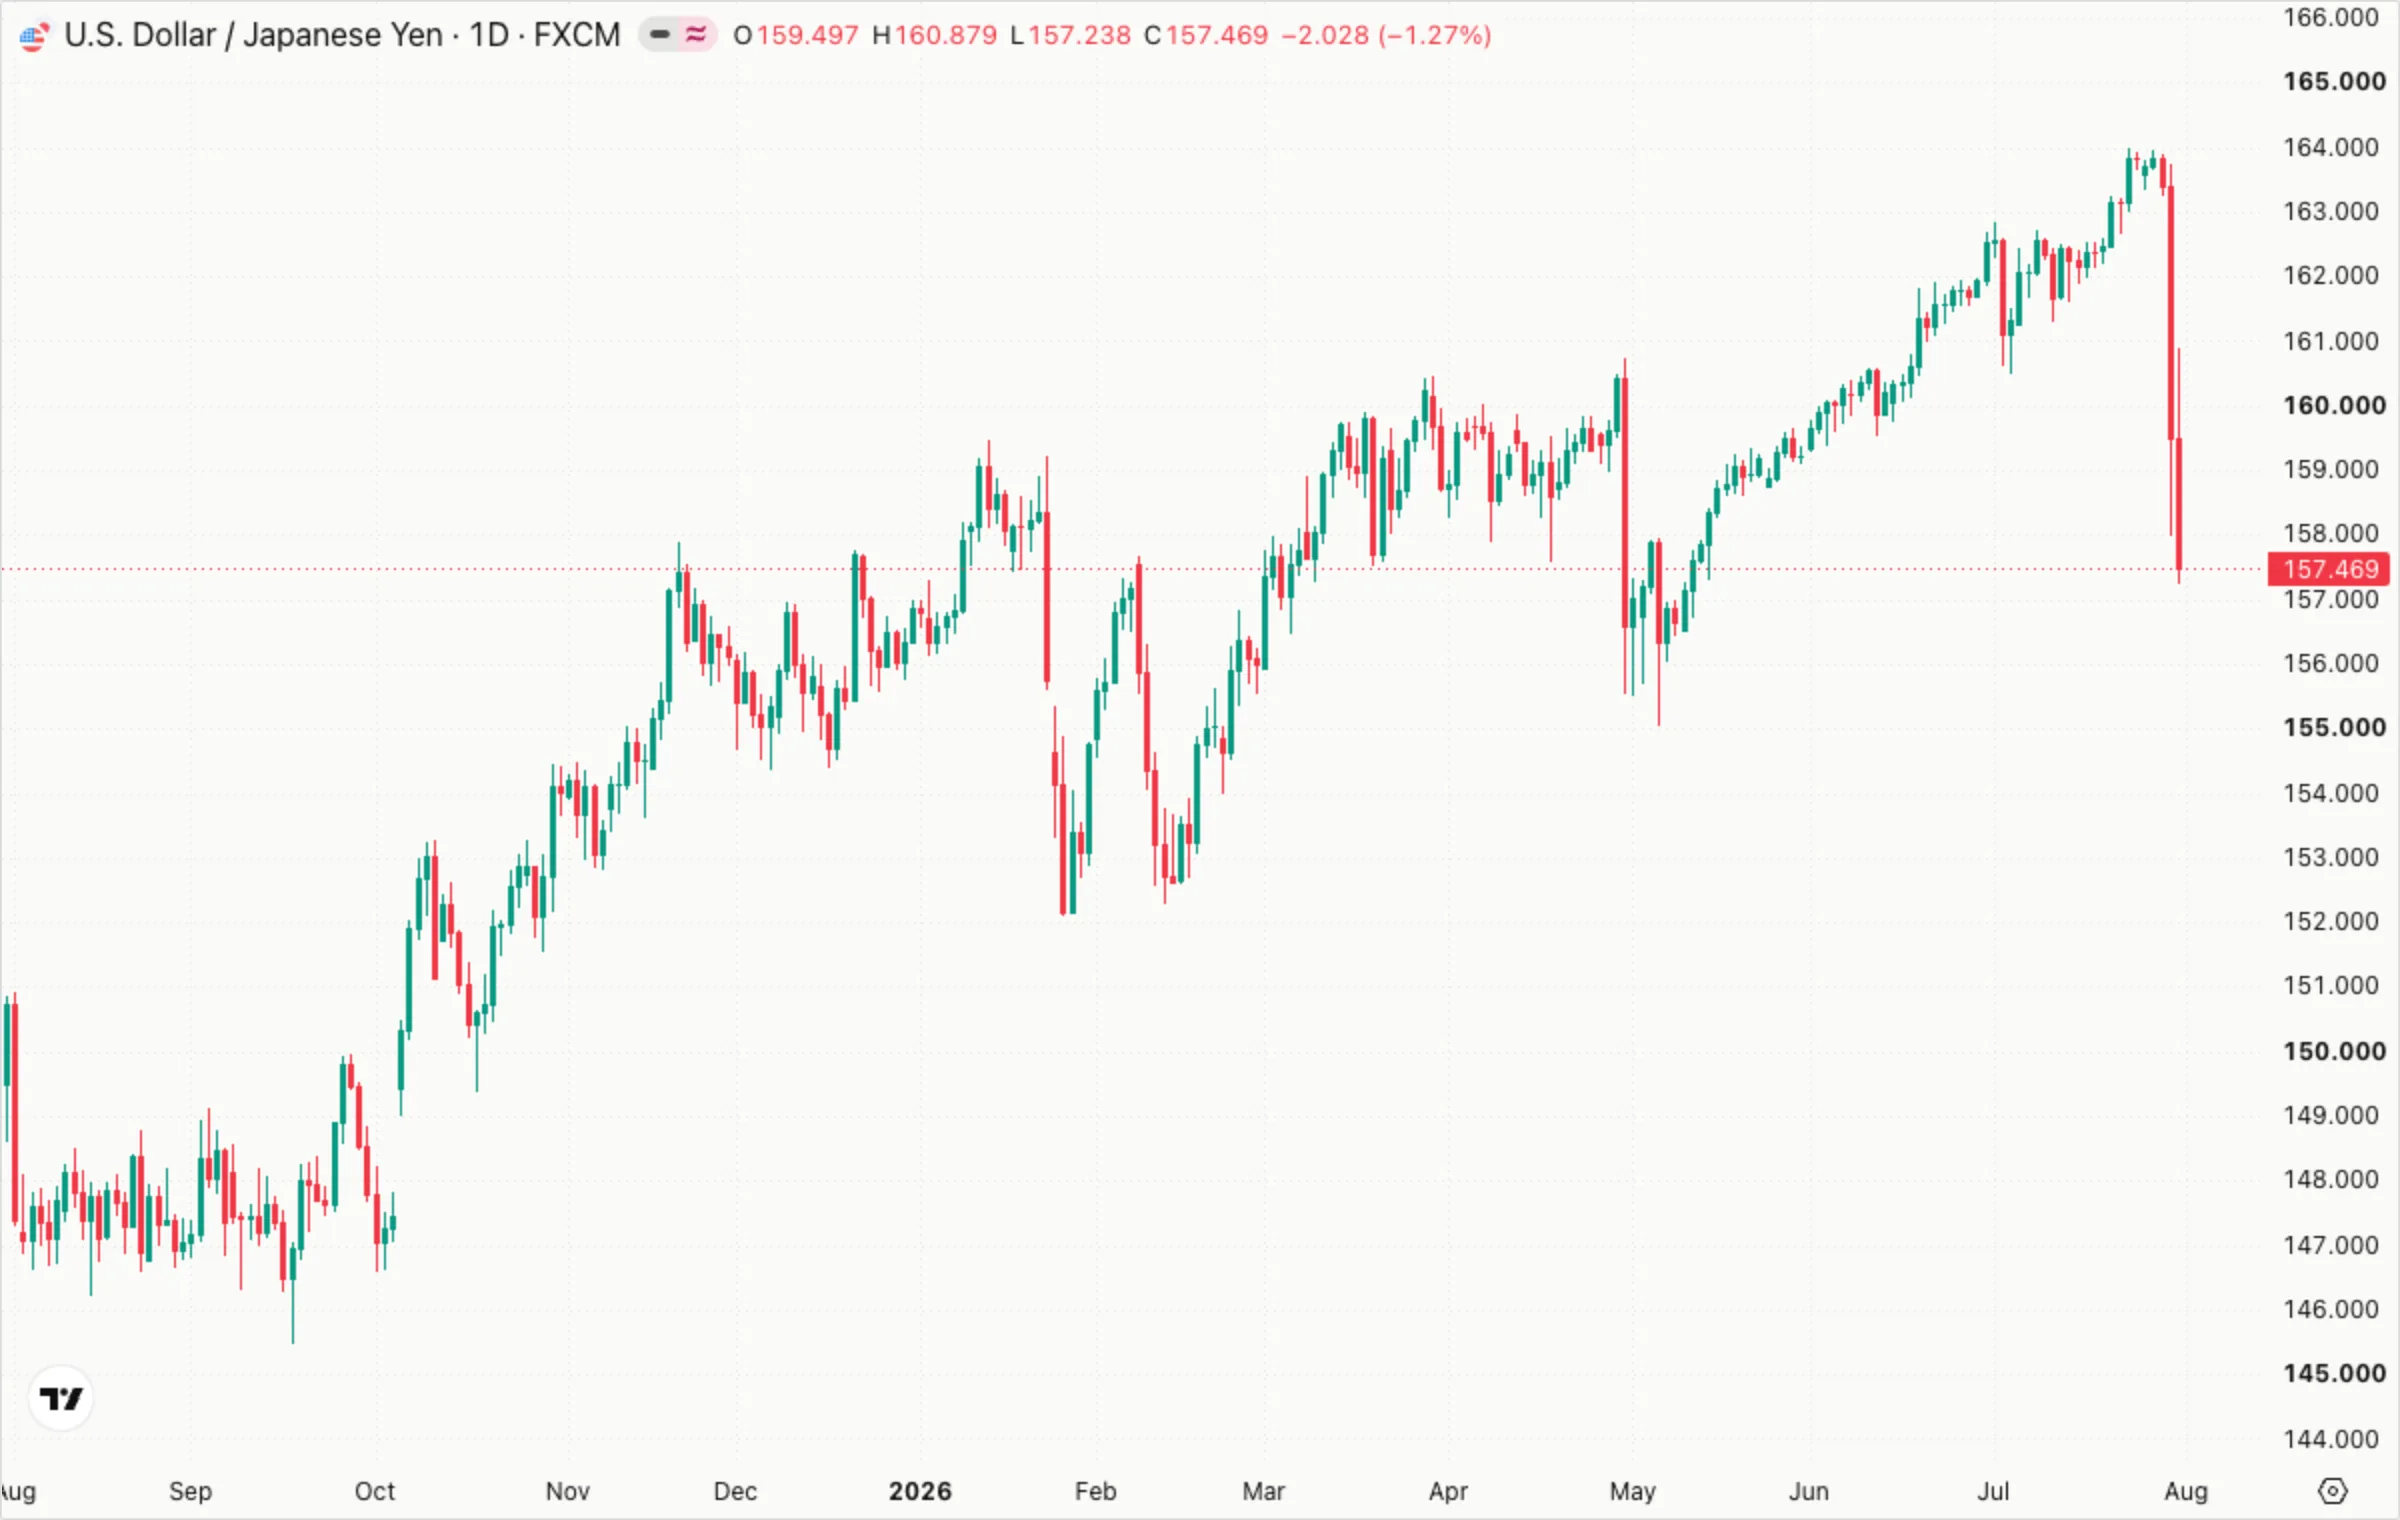
U.S. Dollar / Japanese Yen · daily · chart by TradingView
For twelve months this was the easiest picture in the market. From about 147 last August the
dollar climbed against the yen in the manner trends of this kind always climb — not in a rush, but
in a staircase: three steps up, one small step back, no step back ever quite undoing the three.
Such a chart makes converts. It rewards the man who stops thinking and simply holds, and it goes
on rewarding him right up until the day it doesn’t.
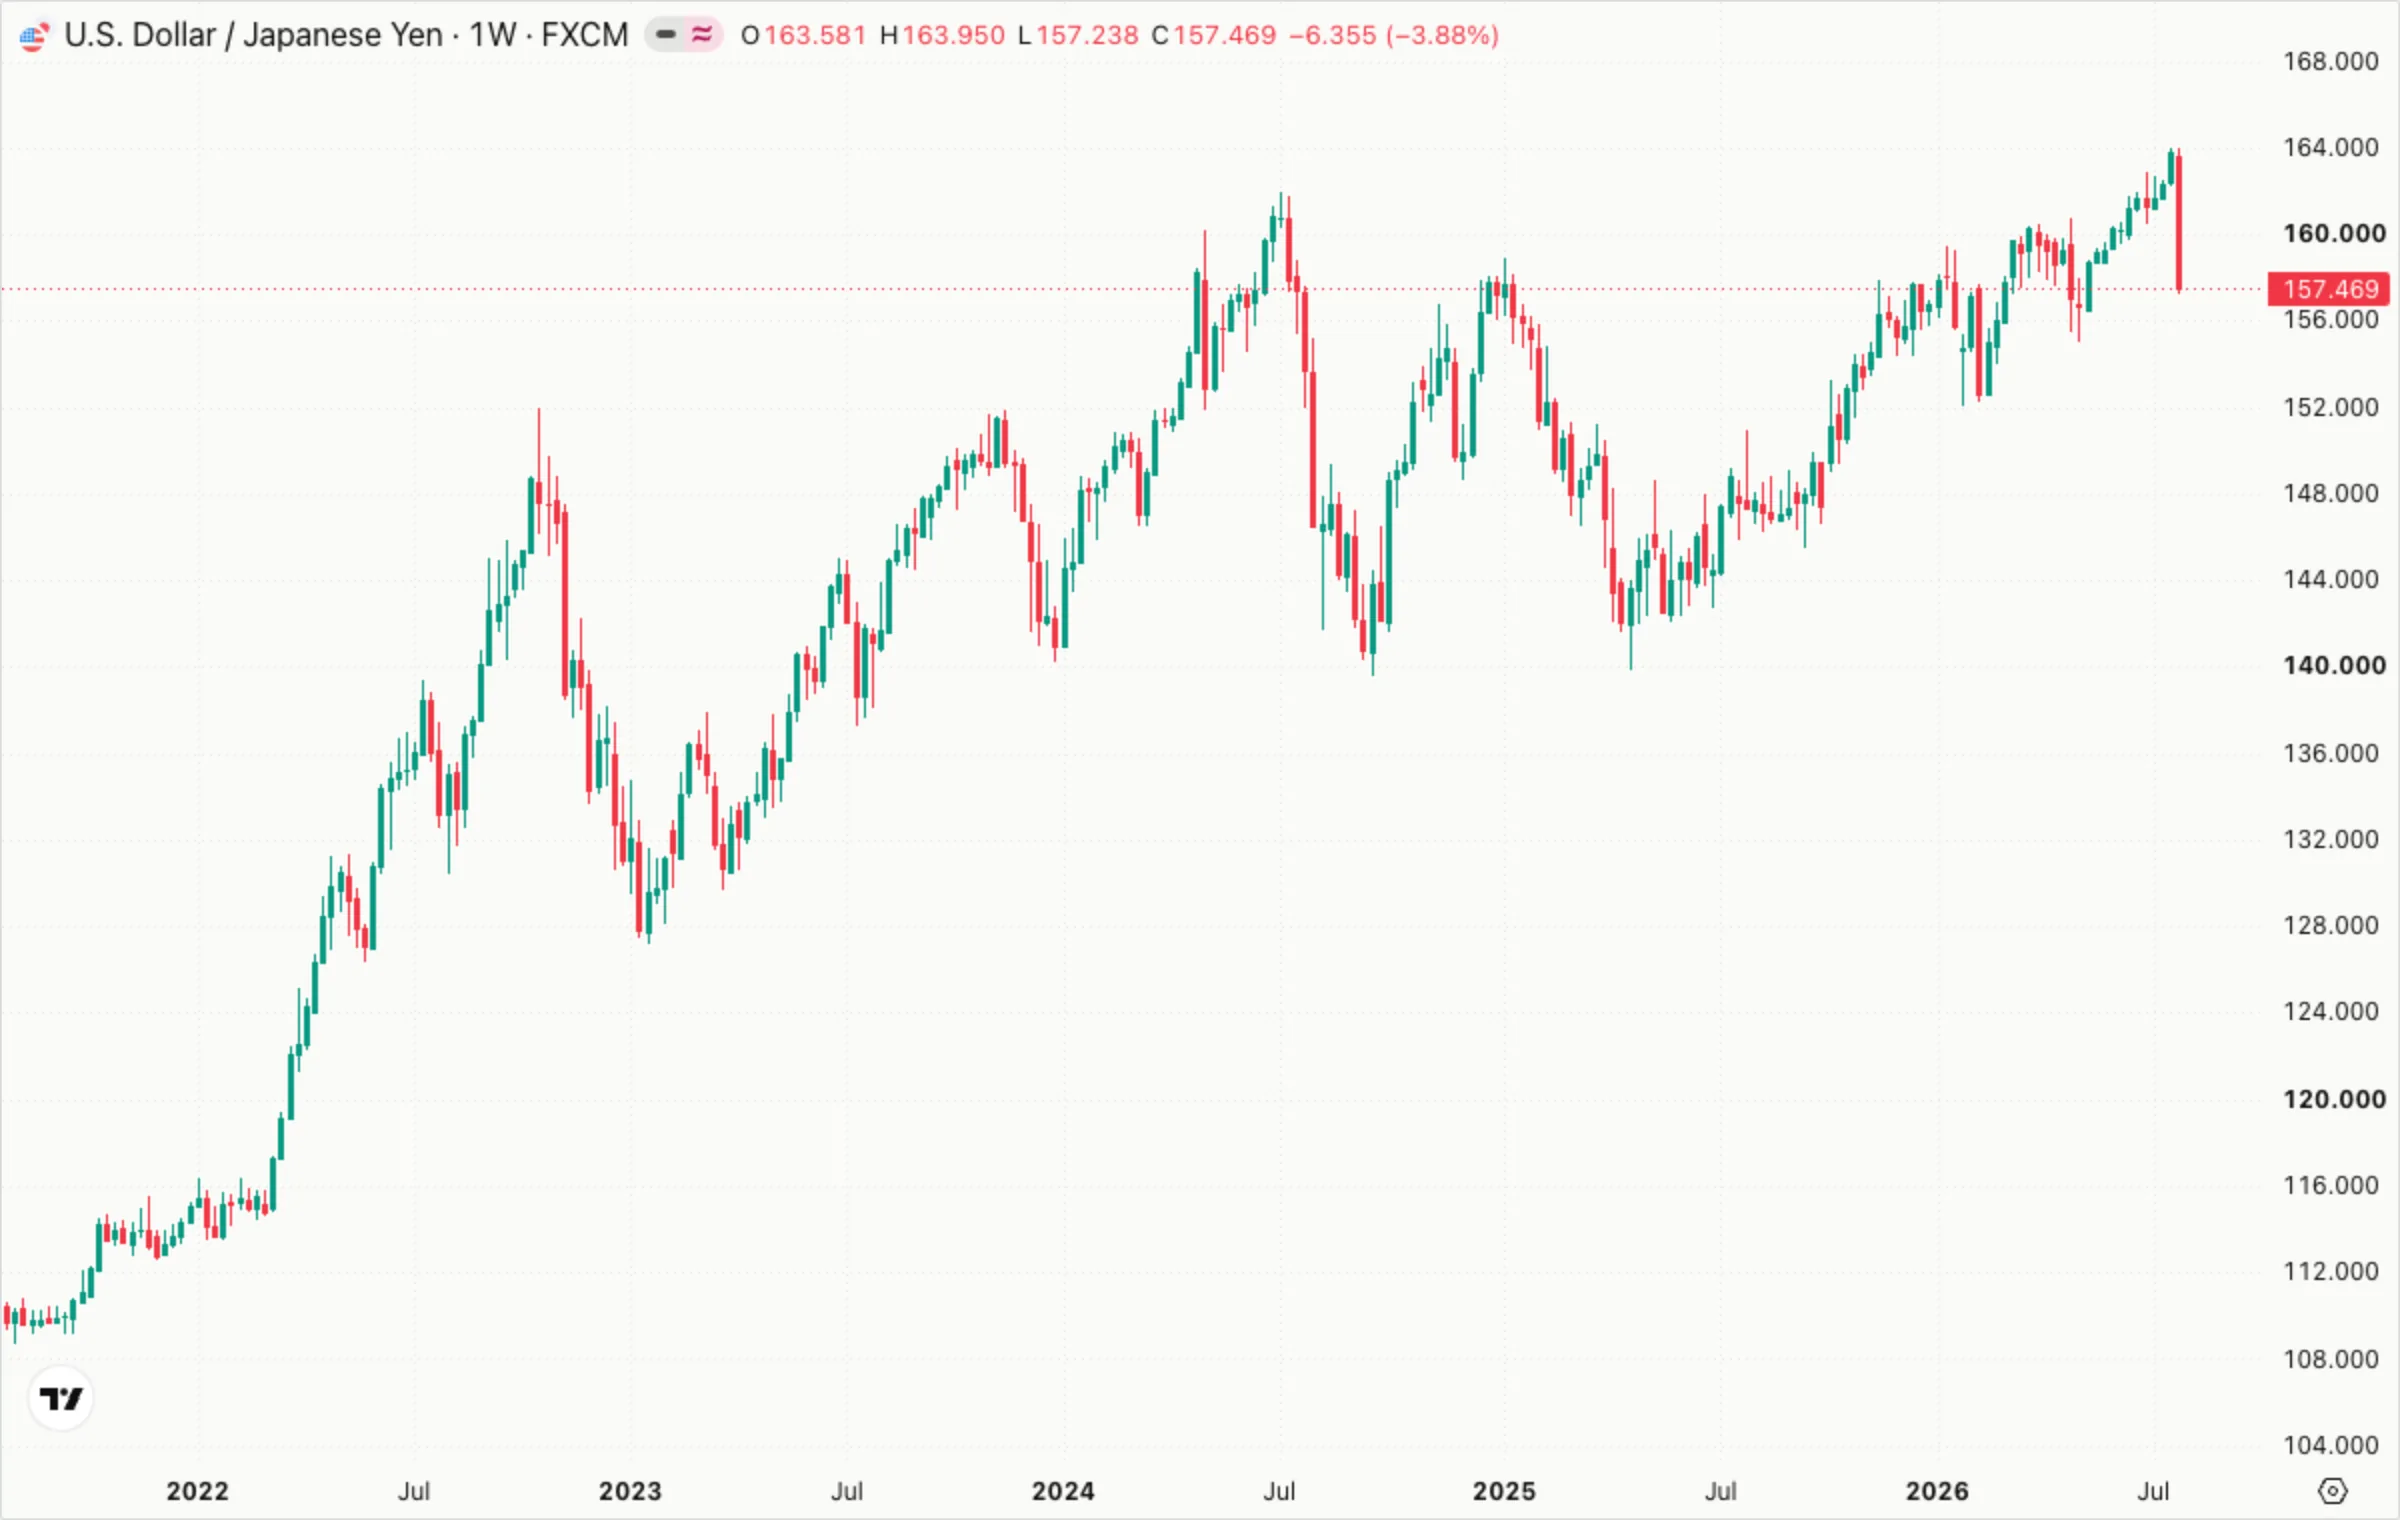
It carried to 163.95 — the weakest the yen has been against the dollar since 1986, a four-decade
low, and in the twenty years of continuous futures this desk keeps, the ten cheapest closes on the
whole file all fall inside the past five weeks. That is the number that finally made the move
political. A currency at a forty-year low is no longer a market story in Tokyo; it is an import-price
story, and with the energy shock from the Iran war already running through the cost of living, a
weak yen had stopped being an export subsidy and started being a household tax.
So on Thursday night the Ministry of Finance stopped talking. At around half past ten Tokyo time,
in thin New York hours, the yen went from about 162.80 to the 157 handle inside a single hour.
Nikkei called it a massive yen-buying operation; the Bank’s own current-account data, as read by
Bloomberg, put it near ¥8.45 trillion — roughly $53 billion, the largest single day Tokyo has
ever spent. The dollar closed Thursday at 159.22.
Friday brought the part that actually matters. Japan came back for a second consecutive day — and
this time Washington came with it. The Financial Times reported that the Federal Reserve Bank of
New York sold euros for yen on behalf of the U.S. Treasury, executing through Goldman Sachs and
Morgan Stanley. The dollar dropped from about 158.9 to 157.6 in minutes. It is the first time the
United States has intervened in this currency since 2011, when the G7 acted together after the
earthquake and tsunami. Treasury Secretary Bessent would say only that Japan “may have”
intervened; the Ministry and the New York Fed declined to comment at all. A photographer got a
picture of Bessent’s notepad. It read: Buy Japanese Yen (JPY) $5–10 bil.
Two sessions, six and a half yen, in a market whose entire year had been made of quarter-yen steps.
In the futures, Thursday was the largest single-day advance in the yen in three years — bigger than
anything printed during the unwind of 2024.
What kind of week that was
U.S. Dollar / Japanese Yen · weekly, five years · chart by TradingView
Step back to the weekly bar and the shape states itself plainly. The week opened at 163.58, made
the high of the entire twelve-month move at 163.95, and closed at 157.47 — down 3.88 per cent,
within a quarter of a yen of the lowest price it traded all week.
In any other week I would call that a key reversal and mean something by it. A market that posts
the high of its whole advance and then surrenders the week’s full range to close on the floor has
not had a correction; it has had a change of hands. But honesty about who did the buying is the
whole of this week’s analysis. The supply that had been absent for a year did not finally arrive
from the market. It arrived from the Ministry of Finance and the U.S. Treasury, and it arrived
because a policy threshold was crossed, not because a valuation was.
That distinction is not academic, and the reason sits in this year’s own record. In late April and
early May, Tokyo spent a then-record ¥11.7 trillion — about $73 billion — defending this same
currency. The gains were wiped out within weeks. It intervened again on 11 July to the tune of
$20.7 billion; the yen made new lows a fortnight later. A chart pattern is a photograph of who won
an argument. When one side of the argument is a central bank with a printing press and a mandate,
the photograph tells you far less about tomorrow than it usually does.
So I will not sell you Friday’s candle as proof of a turn. What I will say is that a reversal drawn
by an official hand still leaves a real mark on a real book — and the book was already leaning.
The ledger the crowd does not read
Here is the fact that survives everything above, and it is the reason this week is worth more than
the last three interventions put together.
The Commitments of Traders report that matters is dated 28 July — two days before the first yen
was bought. It shows the commercial hedgers already long the yen with both hands.
CFTC report
Commercial net long
Open interest
12 May 2026
74,143
362,042
2 Jun 2026
127,768
505,555
30 Jun 2026
148,087
438,825
14 Jul 2026
123,418
396,514
21 Jul 2026
154,898
423,796
28 Jul 2026
158,025
432,366
Note what that column does not do. It does not fall while price falls. Through eleven weeks in
which the yen went from cheap to cheapest-in-forty-years, the hedgers’ book more than doubled — and
it grew into rising open interest, which is the detail that separates real accumulation from
bookkeeping. New money took that side. It was not shorts covering into a quiet market; it was fresh
contracts opened against the direction of the tape, before any official bid existed to reward them.
At 158,025 net long, that book sits at the 96th percentile of every weekly report since the
record begins in June 2021. Only nine reports in five years have ever shown the commercials longer
the yen than they are right now — and all nine of them fall inside a single stretch of calendar:
April to July of 2024.
It is worth remembering how that stretch ended, because the sequence is the lesson. The commercial
long peaked at 194,545 contracts on 2 July 2024, with the dollar around 161 yen. Tokyo intervened
in mid-July. Then, on 31 July 2024, the Bank of Japan raised rates — and a soft U.S. payroll print
followed two days later. That combination did what no intervention had managed alone: the dollar
was at 143 within five weeks, and the Nikkei fell twenty per cent in three sessions, its worst since
The hedgers sold the entire rally into the hands panicking to buy it back, cutting from
194,000 to 12,000 contracts by 6 August and flipping outright net short a week later. They were not
prophets. They were positioned before the move and paid during it, which is the only kind of
foresight the market actually compensates.
Intervention did not turn the yen in 2024. It lit the fuse. Policy and positioning burned it.
The cross that pays for it
Australian Dollar / Japanese Yen · daily · chart by TradingView
To see what is actually at stake, look past the dollar to the cross where the yen’s job is most
naked. The Reserve Bank of Australia holds its cash rate at 4.35 per cent; the Bank of Japan holds
the overnight call rate at 1.00. Three and a third points, paid to you for doing nothing but
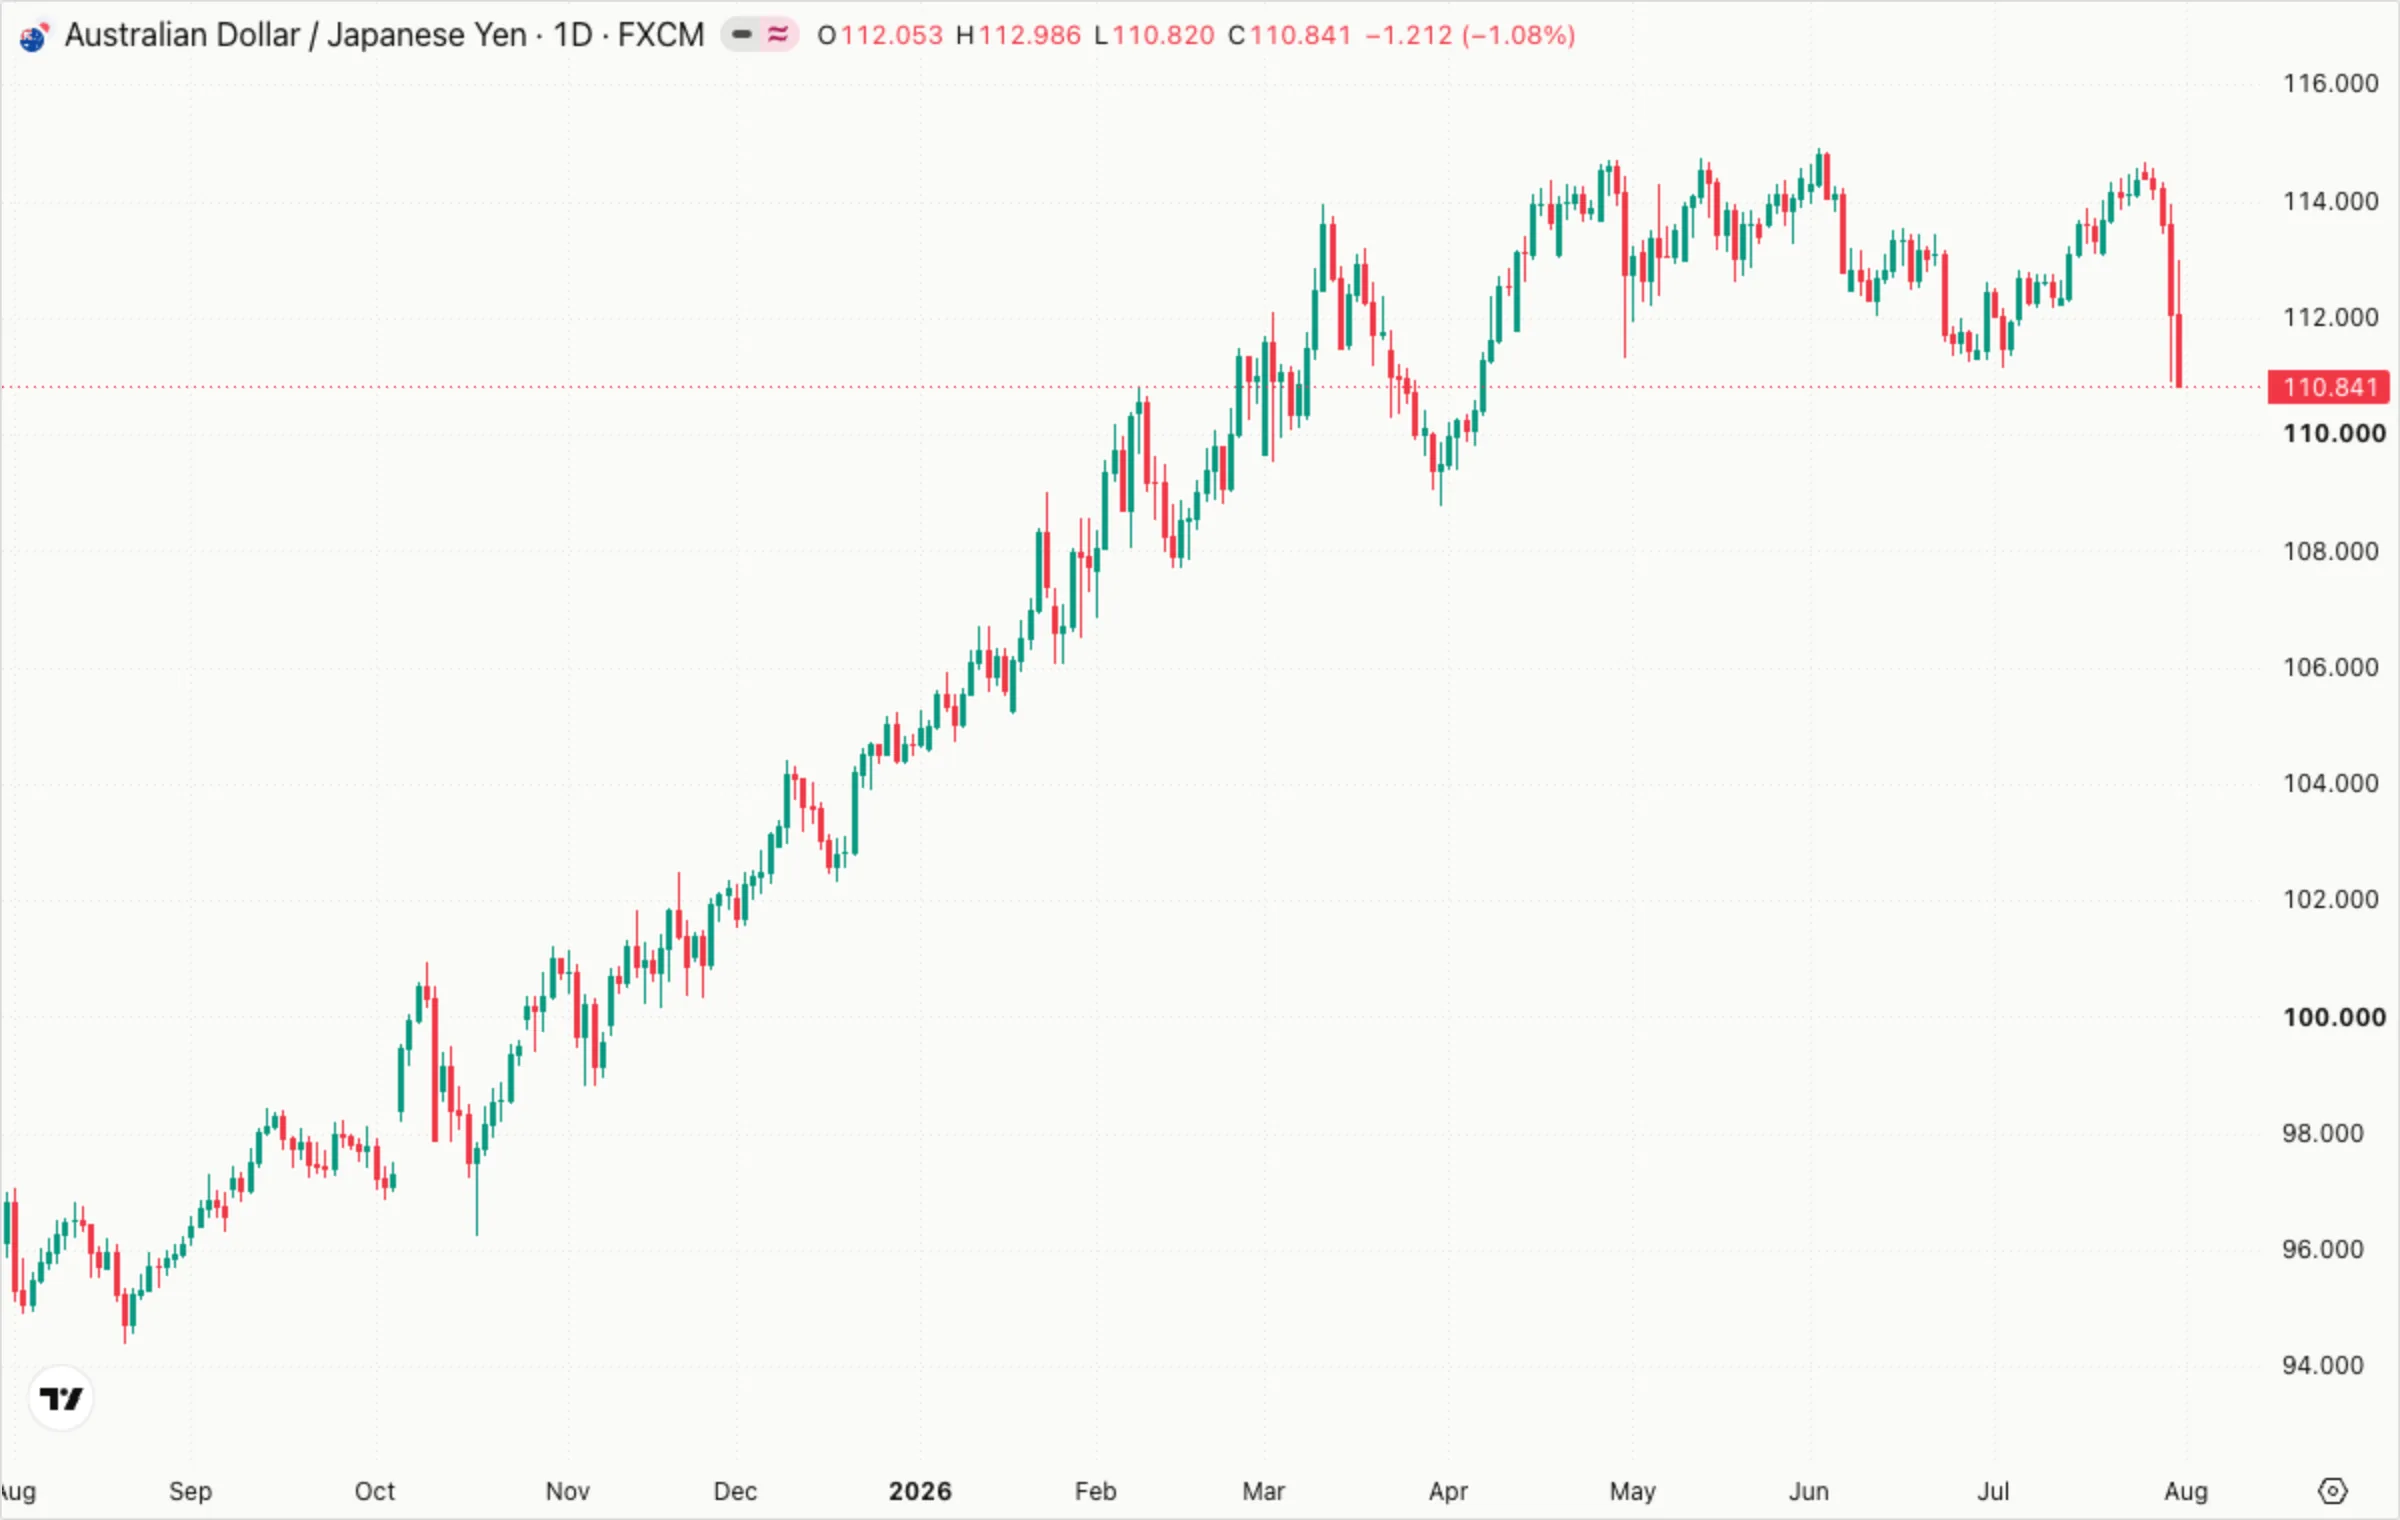
staying in the trade — and a chart that ran from the mid-90s to better than 115, a twenty per cent
capital gain stacked on top of the interest. That is the carry trade entire: you are paid to wait,
and the waiting has been going up.
Friday it closed at 110.841, off 1.08 per cent and some four yen from the July high. The first real
crack in the most comfortable trade in currencies.
And here is the tension worth sitting with. ChartHorizon’s own strength board, dated 1 August,
still ranks AUD/JPY the second-most bullish pair on it at Bull +4.1 of 12, with the Australian
dollar the strongest currency on the board at +4 and the yen still on the weak side at −0.1. The
board is not wrong. It measures the trend that has been, and that trend is genuinely, measurably
intact. The tape measures what is happening now. When the two disagree the honest reading is never
“the board is broken” — it is that the board has not yet been asked the question the Ministry of
Finance asked on Thursday night.
One quieter tell sits in the same table. The only cheaper funding currency in the developed world
is the Swiss franc at zero — and on the same board the franc is the weakest currency at −1.0,
with CHF/JPY listed among the bearish pairs. Between the world’s two funding currencies, the yen
has already stopped being the loser. That is a small thing. Small things are what the front of a
turn is made of.
The read
The yen is not in a bull market, and an intervention is not a trend. Let me be plain about that,
because the temptation after a violent week is to promote a bounce into a new era. The line of
least resistance has run one way for twelve months, and two nights of official buying do not repeal
twelve months. This same government spent a bigger sum in April and had it taken away inside a
month. Anyone who buys the yen purely because the state is buying it has entered a partnership in
which he is the junior party and cannot see the books.
What has changed is not the trend. It is the number of things now standing in the same place at the
same time — and two of them are genuinely new.
The first is the company Tokyo is keeping. The analysts’ standing objection to every intervention
this year has been that Japan can slow a move but cannot turn one without a shift in U.S. rates or
help from Washington. On Friday, help from Washington arrived — the first American operation in
this currency since 2011. A unilateral intervention is a subsidy for the shorts. A coordinated one
is a statement about what the G7 will tolerate, and markets have historically extended it a good
deal more respect.
The second is the ledger. The commercial book was at the 96th percentile of five years before the
first yen was bought. Intervention fired into a crowded, one-sided, profitable short is how a
squeeze starts; intervention fired into a market that is not positioned is merely an expensive
gesture. Every failed defence this year was the second kind. This one is the first.
And what is missing is the piece that did the real work in 2024. On Friday the Bank of Japan held
at 1.00 per cent, and Governor Ueda offered the currency nothing fresh. In 2024 the rout required a
hike, not a defence. The Bank did say core inflation is likely to run “clearly above” two per cent
from the second half of the fiscal year, and most economists polled by Reuters look for 1.25 per
cent by year-end — so the fuse exists. It is simply not lit yet.
That gives a watch-list rather than a position, which is the correct thing to hold at this
particular hour. Let the dollar fail to reclaim 160 and roll over into a lower high, and the
reversal begins to build a structure instead of a single official bar. Let AUD/JPY lose the shelf
around 110, and the carry crowd is no longer defending — it is liquidating, and liquidation feeds
itself. Above all, let the next COT reports show the hedgers holding that long rather than quietly
selling it into the government’s bid, because a commercial book that stays heavy while price rallies
is a different animal from one that lightens into strength. And watch the Bank, not the Ministry:
the day the market prices 1.25 per cent as a certainty is the day the 2024 sequence has assembled
its last piece. Equally, let the dollar grind back over 161 and print a new high, and last week
joins April and July on the list of expensive gestures.
The pivotal point has been reached. That is all that can honestly be said today — and it is not
nothing, because the pivotal point is where every move of importance begins and also where every
false alarm goes to die. Governments can buy a currency. They have never yet bought a trend. What
they can do is choose the hour at which an overcrowded position must finally justify itself, and
they have chosen it. The trend still says one thing and the ledger says another; the tape has begun
to argue for the ledger, and it has not yet finished the sentence. There is no prize for guessing
the ending, and no penalty at all for waiting to read it.
]]>ChartHorizonThe Hedgers’ Ledger — 2026-08-012026-08-01T00:00:00+02:002026-08-01T00:00:00+02:00https://chart-horizon.com/2026/08/01/hedgers-ledgerThe report dated 2026-07-28 shows commercial hedgers pressed to a three-year positioning high in three markets — Euro FX and Canadian Dollar fresh to that register this week, the 10-Year T-Note already established there — with no market at the opposite extreme among the entries tracked here. The lean is one-sided, and the broader board carries additional extremes this issue does not detail. Three highs, no lows, and two of them newly arrived: that is not a crowded tape on both sides of the ledger — it is a tape that has chosen a direction, at least for now, and the sitting will tell us whether it holds.
Market
Side
Percentile
New
Euro FX
▲ HIGH
99th
New
10-Year U.S. T-Note
▲ HIGH
96th
Canadian Dollar
▲ HIGH
96th
New
Euro FX — commercials at a 3-year HIGH
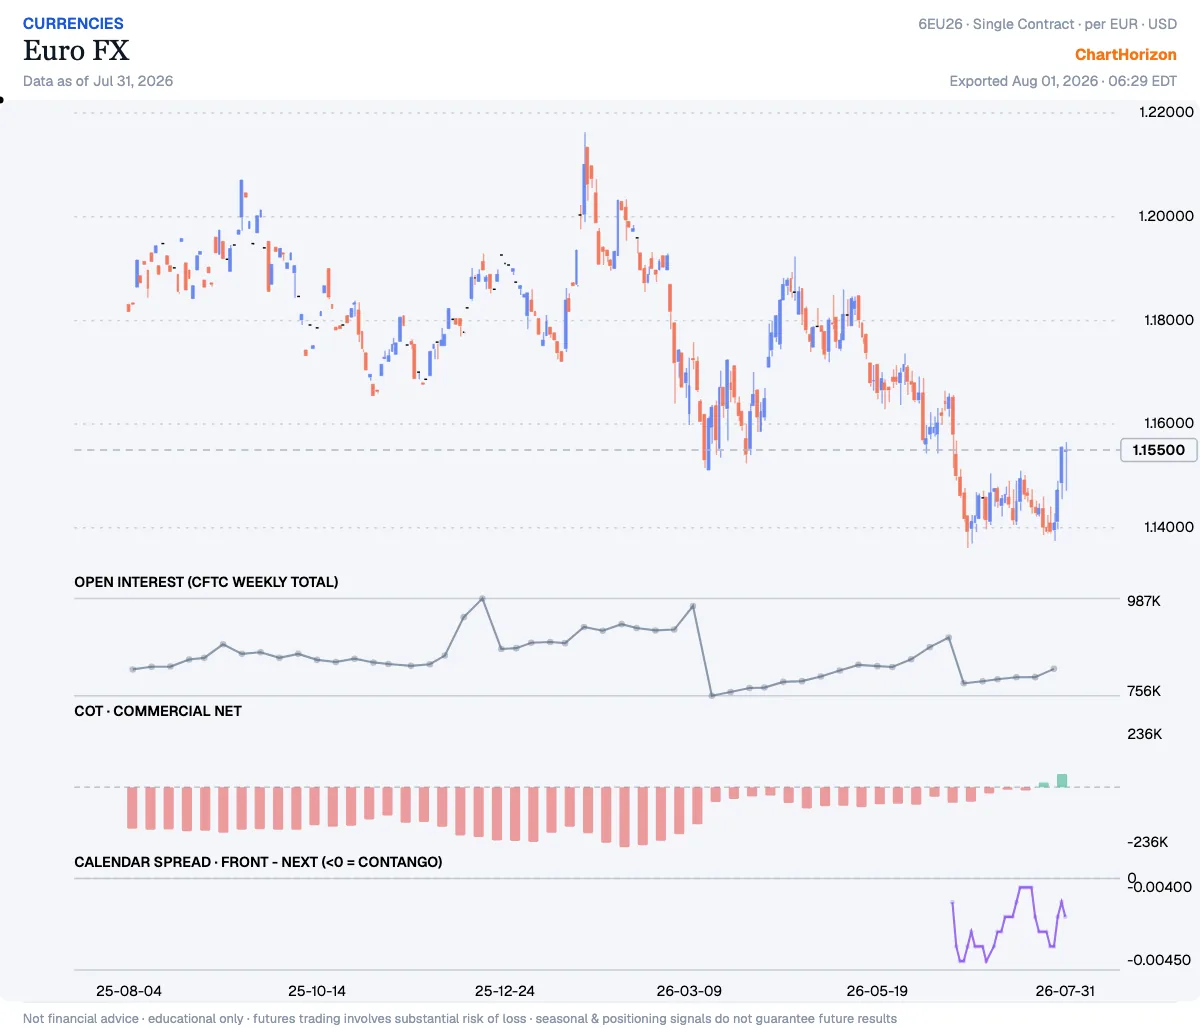
Commercial Net sits at the 99th percentile of its ~3-year range — the commercials (hedgers, the “smart-money” side) have been heavy net buyers. Net: +51,714 contracts (as of 2026-07-28). New this week.
10-Year U.S. T-Note — commercials at a 3-year HIGH
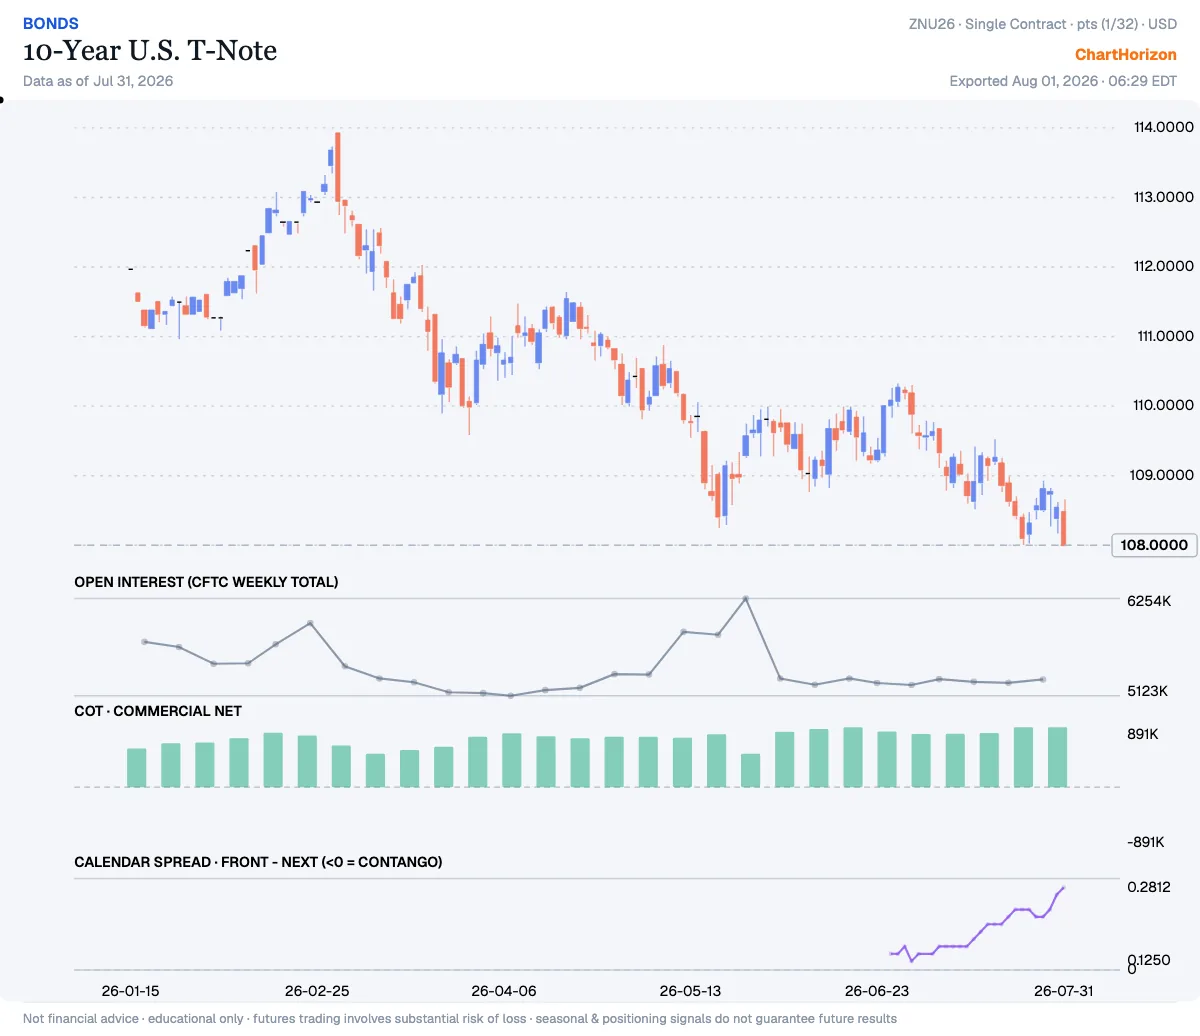
Commercial Net sits at the 96th percentile of its ~3-year range — the commercials (hedgers, the “smart-money” side) have been heavy net buyers. Net: +890,267 contracts (as of 2026-07-28).
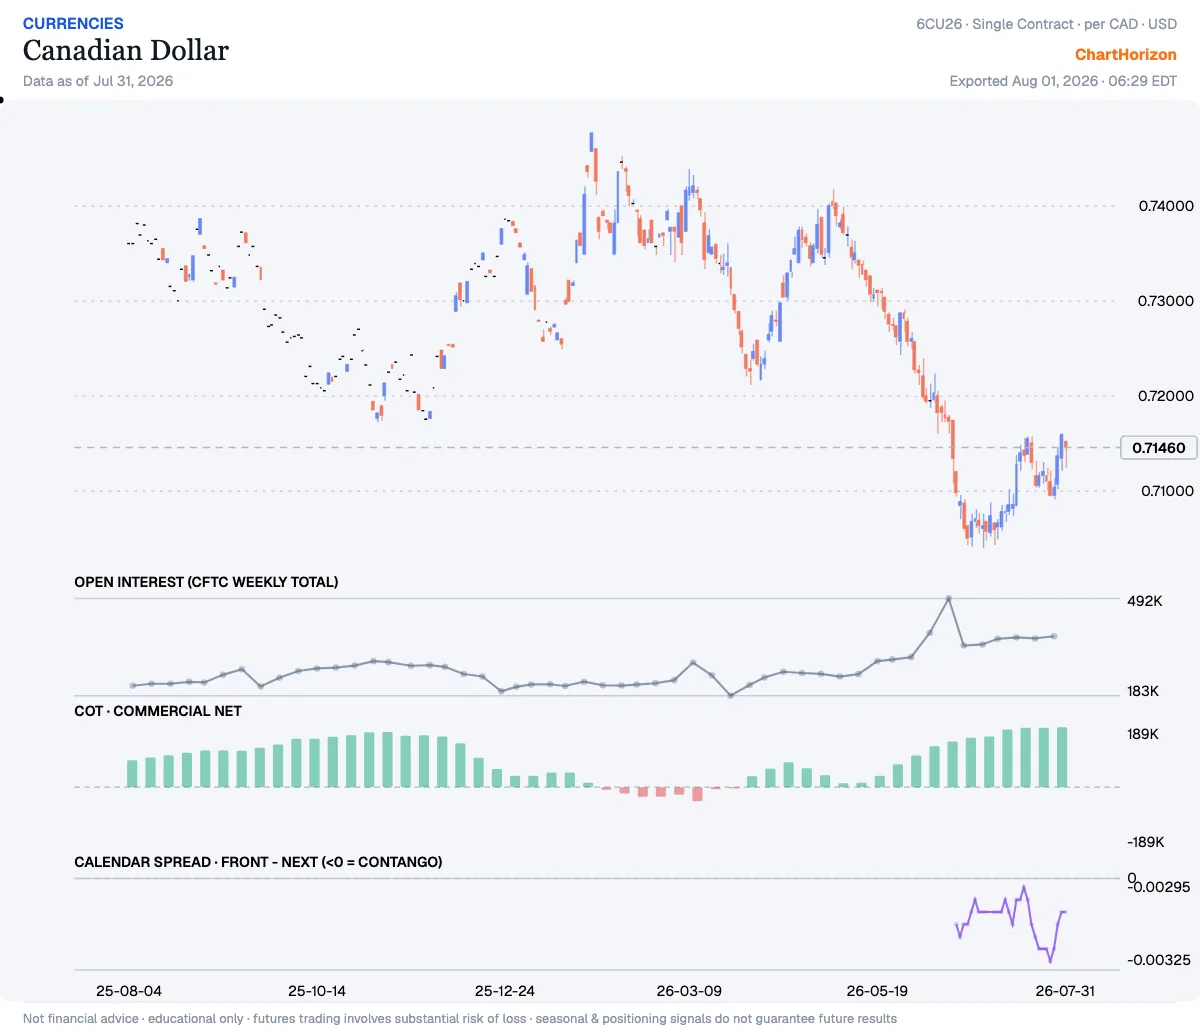
Canadian Dollar — commercials at a 3-year HIGH
Commercial Net sits at the 96th percentile of its ~3-year range — the commercials (hedgers, the “smart-money” side) have been heavy net buyers. Net: +189,021 contracts (as of 2026-07-28). New this week.
]]>ChartHorizonThe Hedgers’ Ledger — 2026-07-252026-07-25T00:00:00+02:002026-07-25T00:00:00+02:00https://chart-horizon.com/2026/07/25/hedgers-ledgerThe tape dated 21 July 2026 shows four markets registering positioning highs within their three-year ranges — WTI Crude Oil, Silver, Platinum, and the 10-Year U.S. T-Note — and not one market sitting at a low. Every entry on this week’s board is fresh, each arriving at its high for the first time in the current window. The lean is entirely one-sided: commercial hedgers are extended to the heavy end of their recent range across the board, with no counterweight on the opposite side. When the whole room crowds the same wall, the patient man does not rush to join them — he watches to see whether the tape confirms or corrects.
Market
Side
Percentile
New
WTI Crude Oil
▲ HIGH
99th
New
Silver
▲ HIGH
99th
New
Platinum
▲ HIGH
99th
New
10-Year U.S. T-Note
▲ HIGH
96th
New
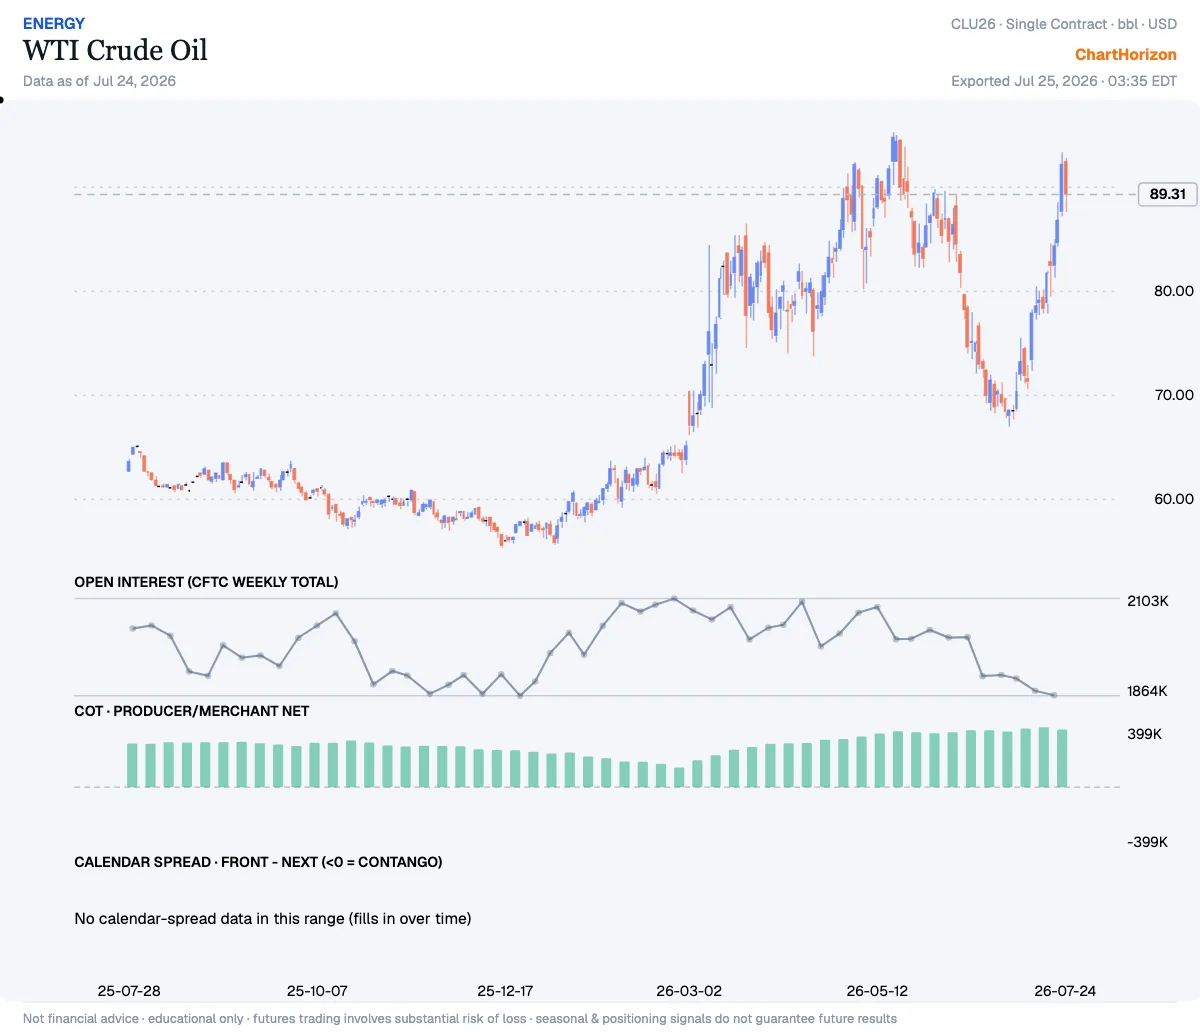
WTI Crude Oil — commercials at a 3-year HIGH
Producer/Merchant Net sits at the 99th percentile of its ~3-year range — the commercials (hedgers, the “smart-money” side) have been heavy net buyers. Net: +383,350 contracts (as of 2026-07-21). New this week.
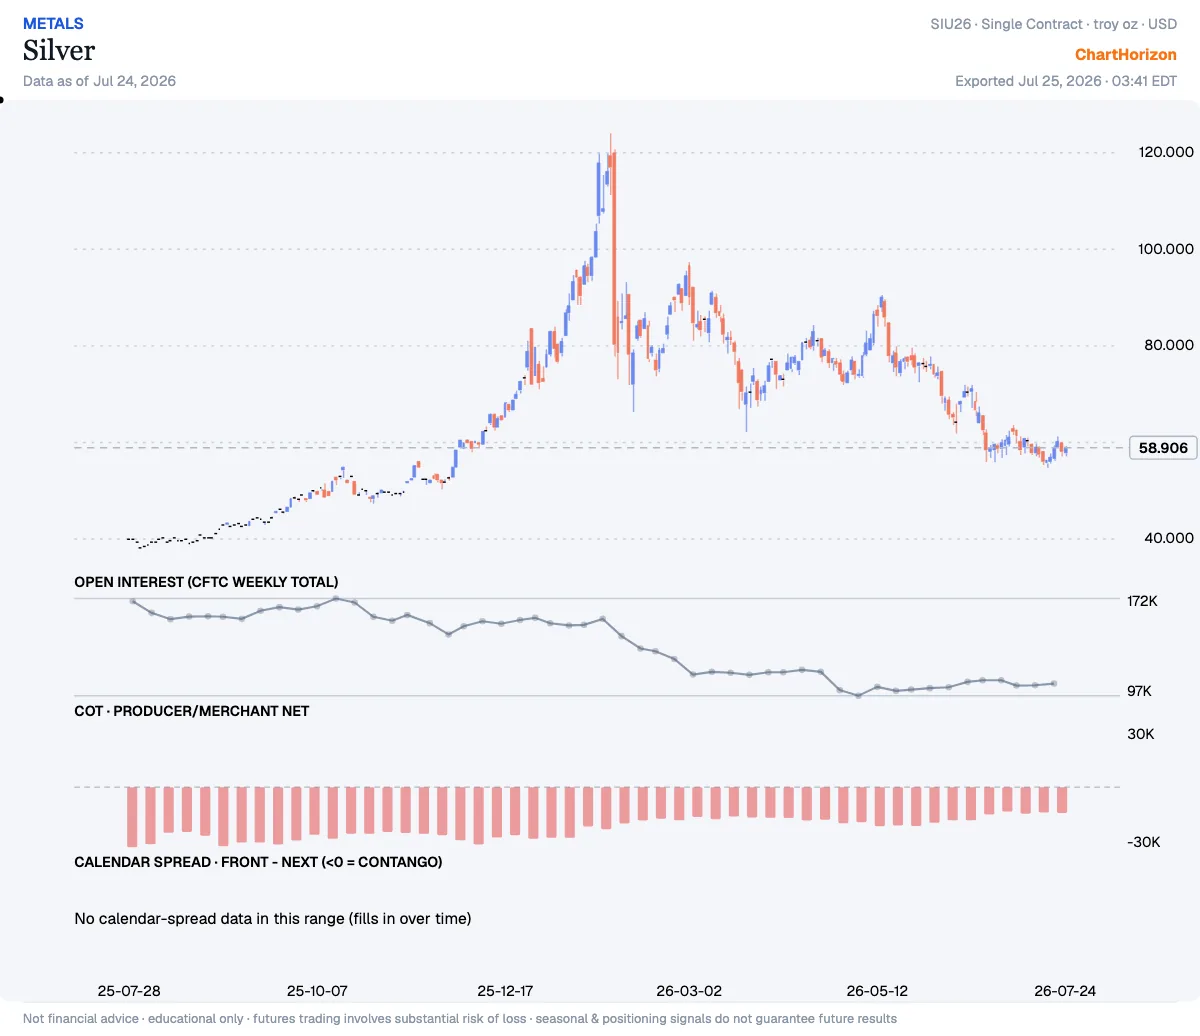
Silver — commercials at a 3-year HIGH
Producer/Merchant Net sits at the 99th percentile of its ~3-year range — the commercials (hedgers, the “smart-money” side) have been heavy net buyers. Net: -13,044 contracts (as of 2026-07-21). New this week.
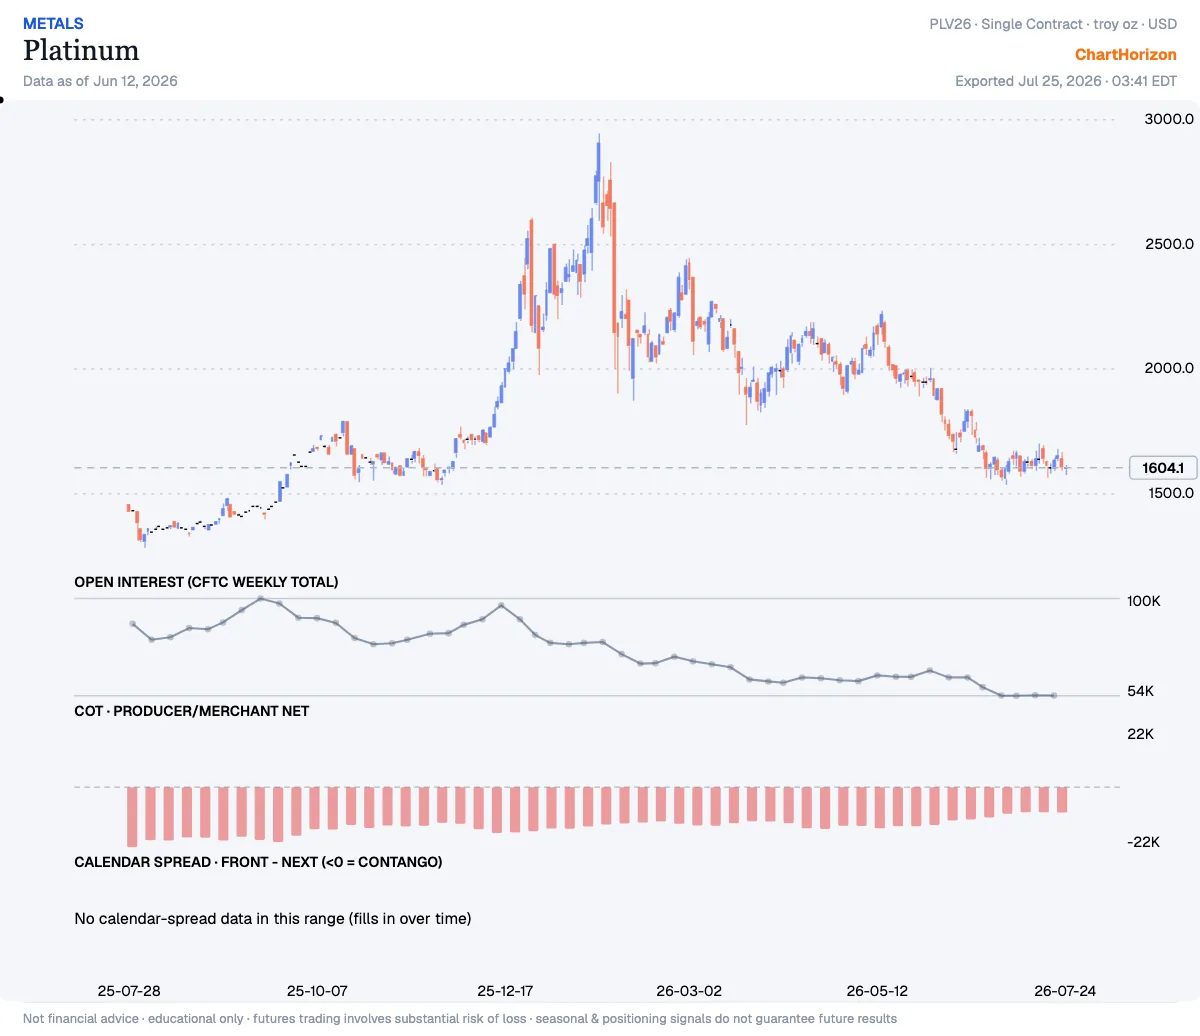
Platinum — commercials at a 3-year HIGH
Producer/Merchant Net sits at the 99th percentile of its ~3-year range — the commercials (hedgers, the “smart-money” side) have been heavy net buyers. Net: -9,314 contracts (as of 2026-07-21). New this week.
10-Year U.S. T-Note — commercials at a 3-year HIGH
Commercial Net sits at the 96th percentile of its ~3-year range — the commercials (hedgers, the “smart-money” side) have been heavy net buyers. Net: +890,118 contracts (as of 2026-07-21). New this week.
]]>ChartHorizonThe Hedgers’ Ledger — 2026-07-182026-07-18T00:00:00+02:002026-07-18T00:00:00+02:00https://chart-horizon.com/2026/07/18/hedgers-ledgerThe report dated 14 July 2026 shows the commercial book thin on conviction: no market in this issue’s coverage sits at a positioning high, and Cotton #2 stands as the lone entry at a positioning low — a fresh print, new to the ledger this week. The board beyond these pages carries its own business. One extreme, one side — there is nothing in that shape to force a remark.
Market
Side
Percentile
New
Cotton #2
▼ LOW
4th
New
Cotton #2 — commercials at a 3-year LOW
Producer/Merchant Net sits at the 4th percentile of its ~3-year range — the commercials (hedgers, the “smart-money” side) have been heavy net sellers. Net: -133,903 contracts (as of 2026-07-14). New this week.
]]>ChartHorizonThe Hedgers’ Ledger — 2026-07-112026-07-11T00:00:00+02:002026-07-11T00:00:00+02:00https://chart-horizon.com/2026/07/11/hedgers-ledgerThe COT report dated 7 July 2026 finds the hedger book leaning hard to one side: five markets register positioning highs against the three-year window, and not a single market sits at a low. Three of those five — New Zealand Dollar, WTI Crude Oil, and Platinum — have pushed to fresh window records, while the New Zealand Dollar and Silver enter the extreme column for the first time this week. When the board fills up on one side without a counterweight, the tape is telling you something about where the professionals have already done their selling; the line of least resistance, at that point, is worth watching closely.
Market
Side
Percentile
New
New Zealand Dollar
▲ HIGH
100th
New
WTI Crude Oil
▲ HIGH
100th
Platinum
▲ HIGH
100th
Silver
▲ HIGH
99th
New
British Pound
▲ HIGH
98th
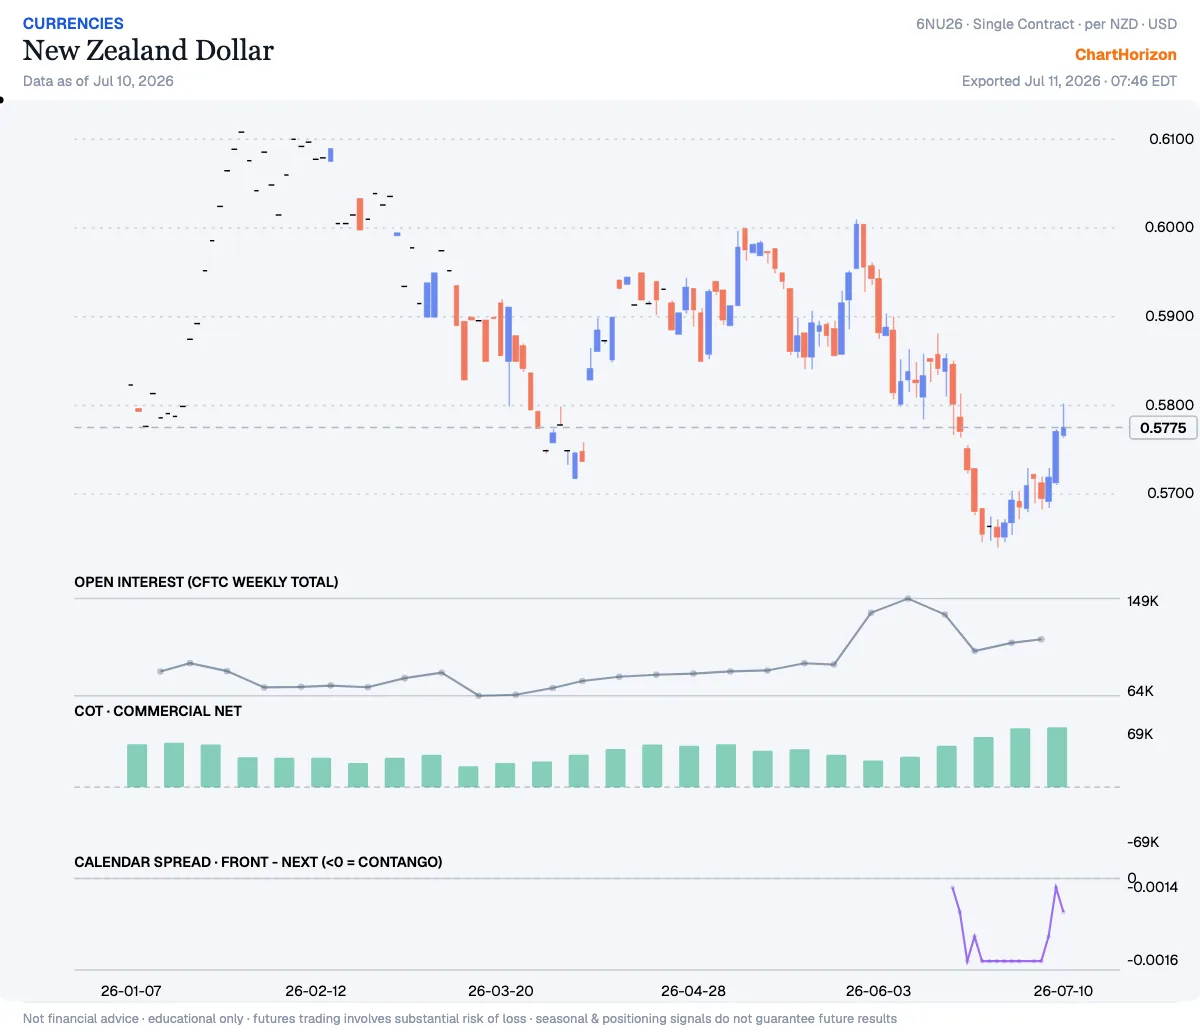
New Zealand Dollar — commercials at a 3-year HIGH (fresh record)
Commercial Net sits at the 100th percentile of its ~3-year range — the commercials (hedgers, the “smart-money” side) have been heavy net buyers. That is a fresh record for the window. Net: +68,783 contracts (as of 2026-07-07). New this week.
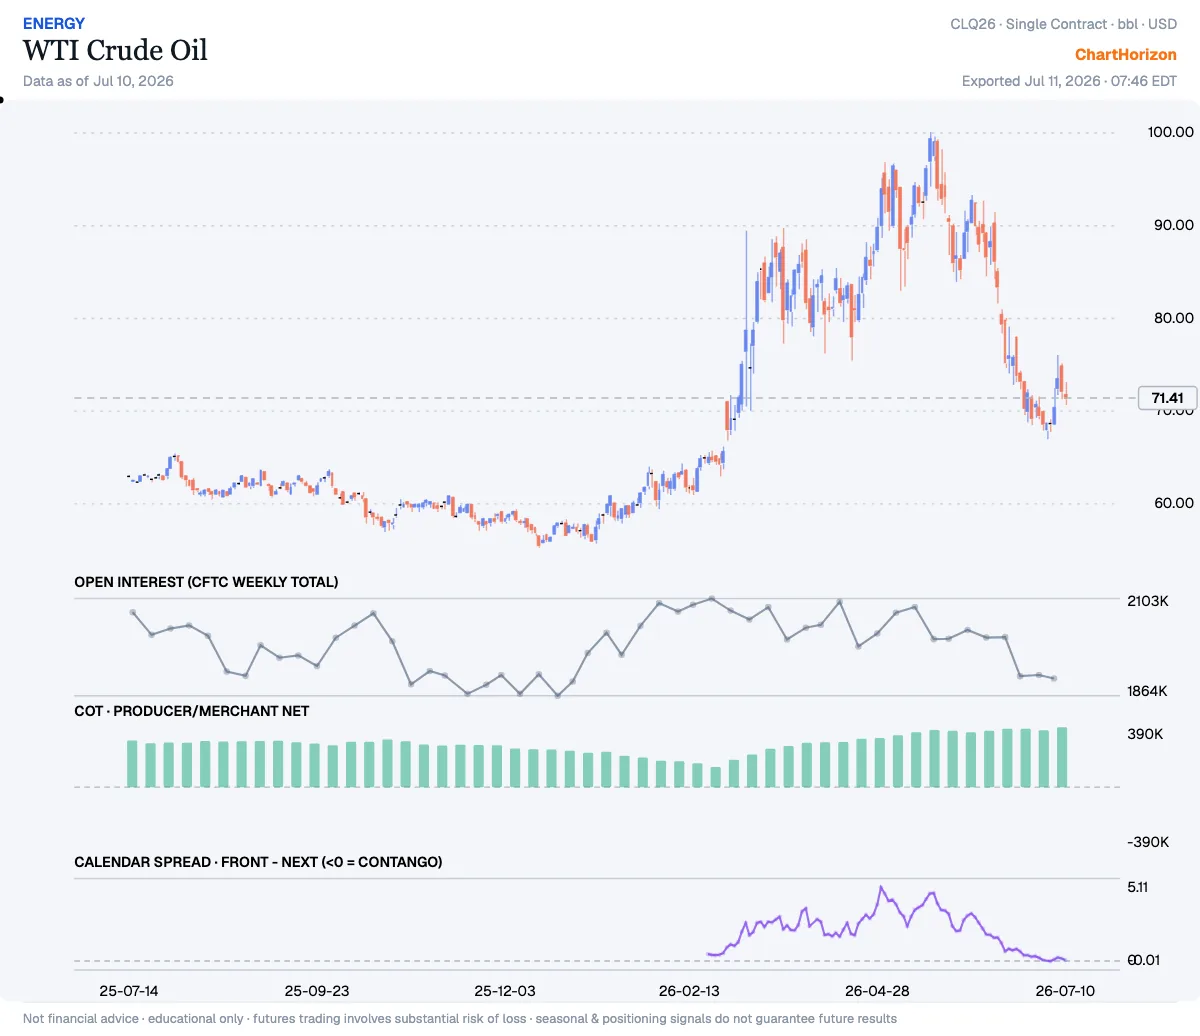
WTI Crude Oil — commercials at a 3-year HIGH (fresh record)
Producer/Merchant Net sits at the 100th percentile of its ~3-year range — the commercials (hedgers, the “smart-money” side) have been heavy net buyers. That is a fresh record for the window. Net: +390,293 contracts (as of 2026-07-07).
Platinum — commercials at a 3-year HIGH (fresh record)
Producer/Merchant Net sits at the 100th percentile of its ~3-year range — the commercials (hedgers, the “smart-money” side) have been heavy net buyers. That is a fresh record for the window. Net: -9,239 contracts (as of 2026-07-07).
Silver — commercials at a 3-year HIGH
Producer/Merchant Net sits at the 99th percentile of its ~3-year range — the commercials (hedgers, the “smart-money” side) have been heavy net buyers. Net: -13,356 contracts (as of 2026-07-07). New this week.
British Pound — commercials at a 3-year HIGH
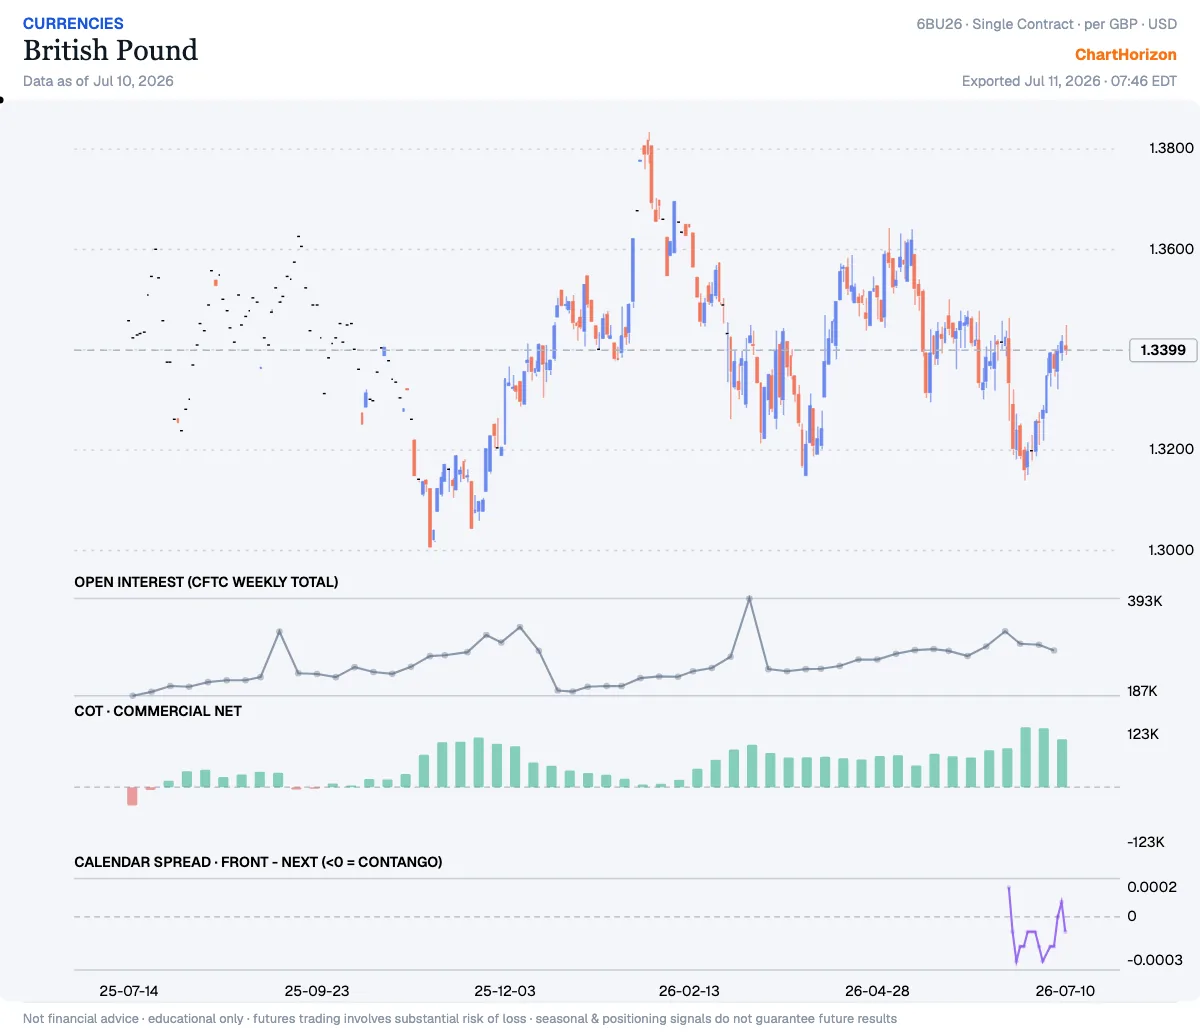
Commercial Net sits at the 98th percentile of its ~3-year range — the commercials (hedgers, the “smart-money” side) have been heavy net buyers. Net: +98,366 contracts (as of 2026-07-07).
]]>ChartHorizonThe Hedgers’ Ledger — a note on the dollar2026-06-27T00:00:00+02:002026-06-27T00:00:00+02:00https://chart-horizon.com/2026/06/27/hedgers-ledger-dollarThe commercials have shown their hand this week, and it points one way: away from the dollar.
The currencies — hedgers pressing long
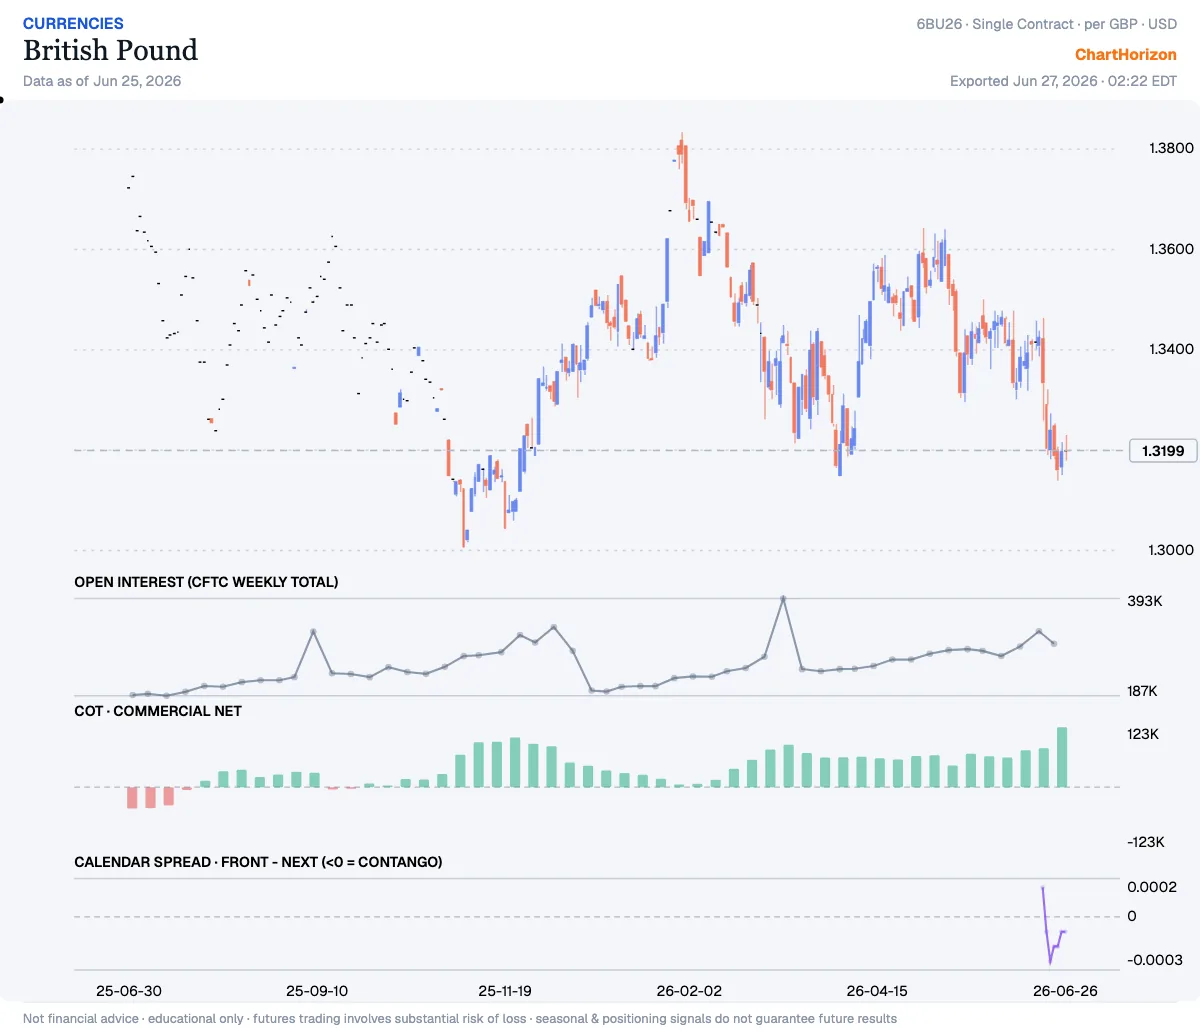
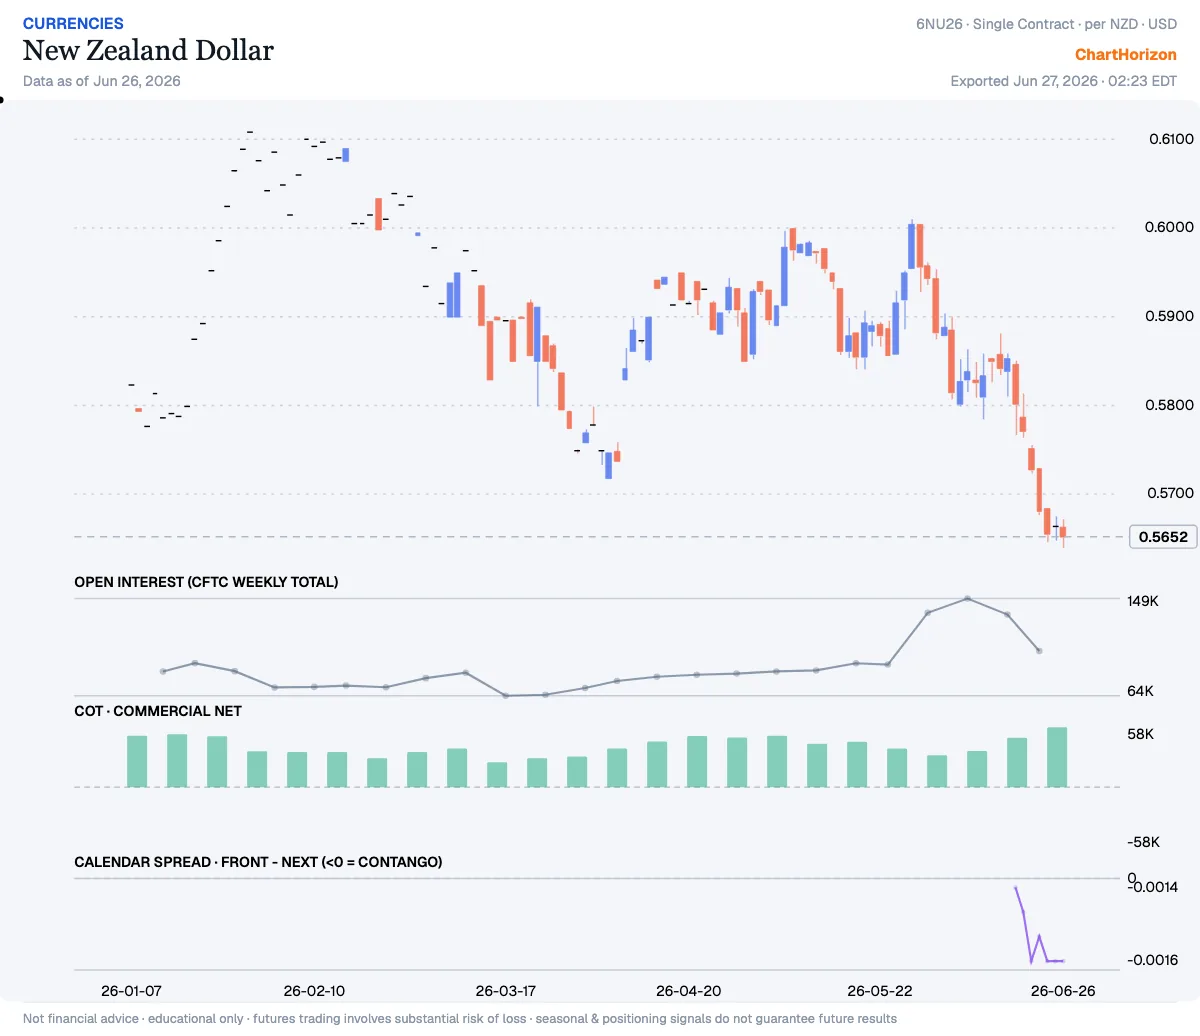
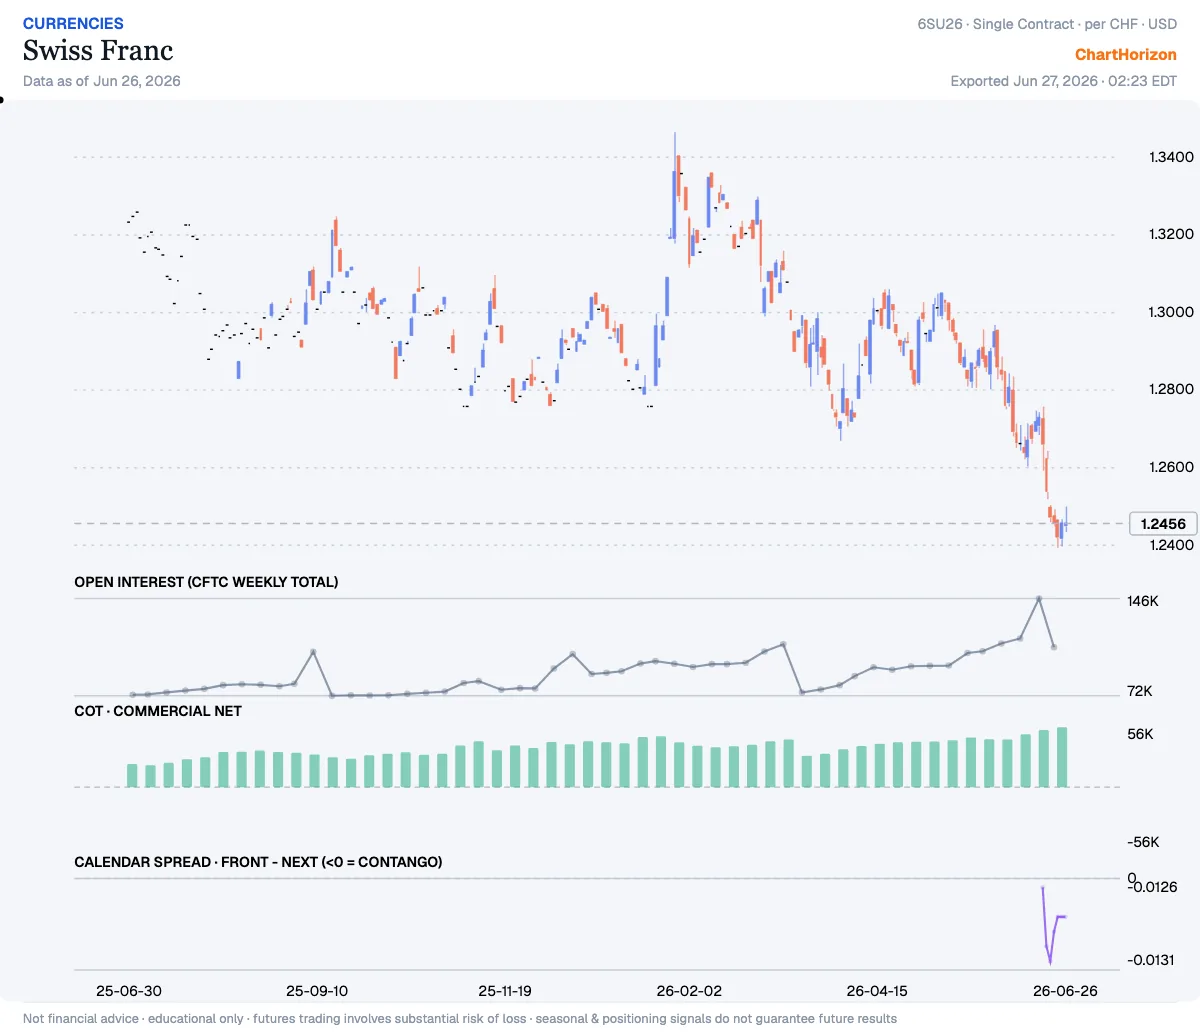
In the currencies the hedgers are not trimming — they are pressing. The commercial book in sterling stands net long 123,431 contracts, up from 79,925 a week ago and a fresh three-year record; the New Zealand dollar (+57,522) and the Swiss franc (+56,495) lean the same way, both stretched further than they have run in years. These are the people who must handle the physical flows, and when they crowd to one side of the boat, an old tape-reader marks which side. Their lean is bullish the currencies — and a bid for the currencies is an offer in the dollar.
The metals — shorts covered into weakness
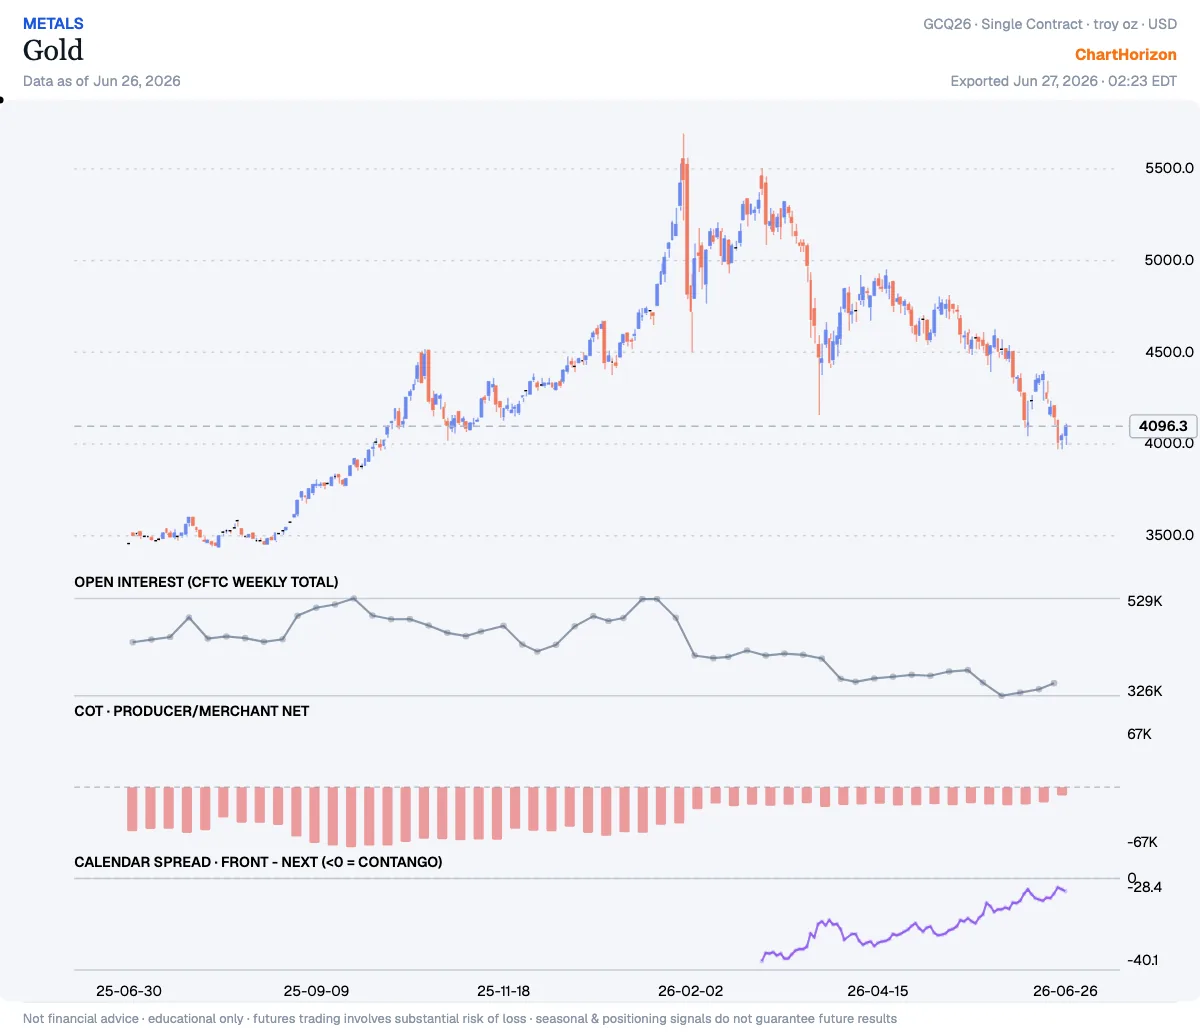
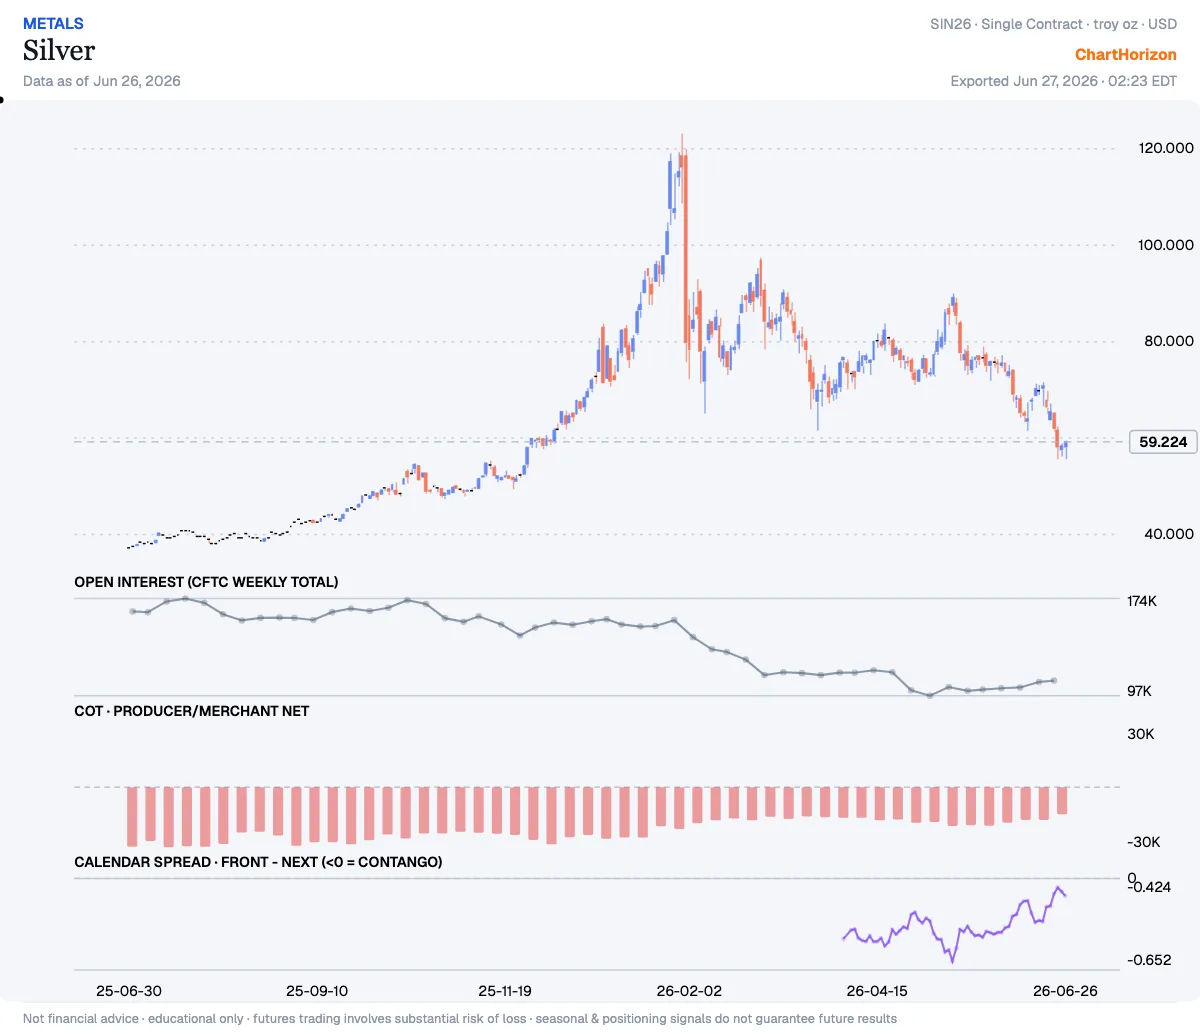
The metals tell the same story from the other end. In gold the commercial net short has been cut nearly in half — from 19,300 contracts to 9,336 — and in silver from better than 16,600 down to 13,722, the shorts bought back week after week even as price fell: gold off better than two hundred dollars, silver back from seventy. Men do not cover into a decline unless they expect the decline to end. The calendar spread confirms the firming — gold’s front-to-next discount narrowed from −30.5 to −29.0, silver’s from −0.53 to −0.45: still a carry, but a carry tightening, not loosening.
The read
Two markets, one message. The smart money is selling the dollar — long the foreign currencies, covering the metal shorts into weakness. I do not call the day or the hour; extremes can stretch, and the structure is firming, not yet inverted. But the line of least resistance, as the hedgers have drawn it, runs against the dollar. The sitting is the position.